320-x-100_uti_gold.jpg" alt="Advertisement">

USDINR opened with a downward gap and remained in a small range throughout the day - Axis Securities

Follow us Now on Telegram ! Get daily 10 - 12 important updates on Business, Finance and Investment. Join our Telegram Channel
USDINR
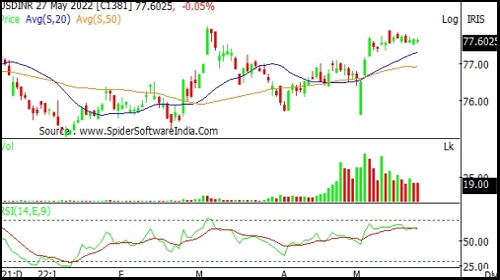
USDINR opened with a downward gap and remained in a small range throughout the day. USDINR closed at 77.60 with a loss of 0.05 %. On the daily chart USDINR has formed a bullish candle however it remained restricted within previous two session's High-Low range indicating absence of strength on either side USDINR continue to move in past couple of trading session's High-Low range representing lackluster movement. Currently USDINR is sustaining above its 20 and 50 day SMA which support bullish sentiments in near term. The chart pattern suggests that if USDINR crosses and sustains above 77.65 level it would witness buying which would lead USDINR towards 77.80-77.95 levels. However if USDINR breaks below 77.45 level it would witness selling which would take USDINR towards 77.30-77.15. The daily strength indicator RSI is moving upwards and above its reference line indicating positive bias. However momentum oscillator Stochastic has turned negative from the overbought zone indicating a possible consolidation or a downmove in the near term
EURINR
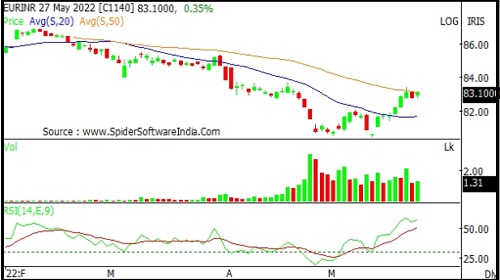
EURINR opened with an upward gap and remained in positive terrain throughout the day. EURINR closed at 83.1 with a gain of 0.35 %. On the daily chart EURINR has formed a sizable bullish candle forming higher HighLow compare to previous session and closed above previous session's high indicating positive bias. EURINR is moving in a Higher Top and Higher Bottom formation on the daily chart indicating sustained up trend. Currently EURINR is sustaining above its 20 day SMA which support bullish sentiments in near term. The chart pattern suggests that if EURINR crosses and sustains above 83.20 level it would witness buying which would lead EURINR towards 83.35-83.50 levels. However if EURINR breaks below 82.70 level it would witness selling which would take EURINR towards 82.55-82.40. The daily strength indicator RSI and momentum oscillator Stochastic both are in positive territory which supports upside strength
JPYINR
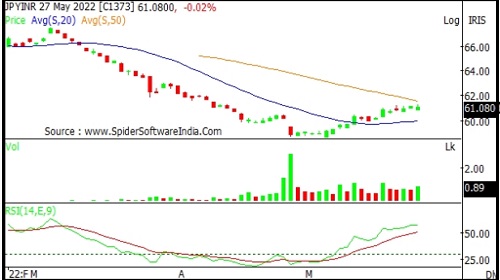
JPYINR opened with a downward gap however buying momentum throughout the session led it to close on positive note.. JPYINR closed at 61.08 with a loss of 0.02 %. On the daily chart JPYINR has formed a small Bullish candle with upper shadow indicating selling pressure as well as resistance at higher levels JPYINR is moving in a Higher Top and Higher Bottom formation on the daily chart indicating sustained up trend. Currently JPYINR is sustaining above its 20 day SMA which support bullish sentiments in near term. The chart pattern suggests that if JPYINR crosses and sustains above 61.30 level it would witness buying which would lead JPYINR towards 61.45-61.60 levels. However if JPYINR breaks below 60.80 level it would witness selling which would take JPYINR towards 60.65-60.45. The daily strength indicator RSI and momentum oscillator Stochastic both are in positive territory which supports upside strength
GBPINR
GBPINR opened with an upward gap and remained in positive terrain throughout the day. GBPINR closed at 97.84 with a gain of 0.87 %. On the daily chart GBPINR has formed a sizable bullish candle forming higher Highlow compare to previous session indicating positive bias GBPINR is moving in a Higher Top and Higher Bottom formation on the hourly chart indicating short term up trend. Currently GBPINR is sustaining above its 20 day SMA which support bullish sentiments in near term. The chart pattern suggests that if GBPINR crosses and sustains above 97.90 level it would witness buying which would lead GBPINR towards 98.10-98.25 levels. However if GBPINR breaks below 97.40 level it would witness selling which would take GBPINR towards 97.25-97.10. The daily strength indicator RSI and momentum oscillator Stochastic both are in positive territory which supports upside strength

To Read Complete Report & Disclaimer Click Here
For More Axis Securities Disclaimer https://simplehai.axisdirect.in/disclaimer-home
SEBI Registration number is INZ000161633
Views express by all participants are for information & academic purpose only. Kindly read disclaimer before referring below views. Click Here For Disclaimer