USDINR near month futures consolidating above 50 weeks simple moving average - HDFC Securities

Follow us Now on Telegram ! Get daily 10 - 12 important updates on Business, Finance and Investment. Join our Telegram Channel
Rupee: Sell in May Month ?
April becomes the bad month for Indian Rupee as it was the worst performing currency among Asian peers amid sharp surge in virus cases which forced many states to implement lockdown/restriction. Worsening situations will adversely impacts the economy with slower growth and higher deficit for this year. Central bank’s dovish policy and focus on growth could weigh on rupee which is already overvalues in terms of REER.
Spot USDINR ended the month with gains of 1.33% or 97 paise to 74.08, steepest appreciation since March last year. Data suggests May month remains bullish for USDINR as we had seen 9 out of last 10 year positive with average gain of 1.57%. Technically, the pair is expected to trade with positive bias in the range of 73 to 76 this month.
The 10 Year benchmark govt. bond yield settled at 6.03, down 14bps this month, most in nearly a year. We could see a dovish-for-longer RBI is holding down the short-end of yield- curve in coming month.
Blistering data from US did not help dollar in April, as dollar index ended the month with loss of 2.09% to 91.28. Risk assets mostly finished April in good shape underpinned by better than expected earnings and easy liquidity condition. At the other end of the spectrum, economic recovery hopes began feeding into higher commodity prices, fueling inflationary concerns, though a patient Fed kept the market calm.
Dollar expected to gain in coming days as 10 year treasury yields start gaining amid mounting inflation expectation and data showing US economic growth is accelerating. ICE dollar index likely to appreicate in coming month with resistance at 92, the 200 days simple moving average and support at 90.30, the trend line adjoining low of 89.21 and 89.68. The view will be negated if bucks break the level of 90.30.
For the month, Inflation and global recovery will remain the key theme. We could see upgrade in growth and inflation from developing nations while Asian countries could feel the hit of higher commodity prices. Market will also looked in to the possibility of third wave of virus and vaccination progress which directly impact the financial market.
USDINR
Technical Observations:
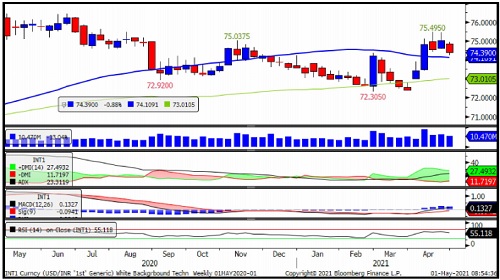
USDINR near month futures consolidating above 50 weeks simple moving average, currently placed at 74.20.
The pair has been in bullish sequence of higher top higher bottom on weekly chart. Momentum oscillator, Relative Strength Index of 14 week periods placed above 50 but turned down suggesting consolidation with positive momentum.
MACD crossed the zero line with positive cross over indicating bullishness.
We remain bullish in USDINR May futures and expect some consolidation before heading towards 76 level.
Monthly Range : 73 to 76.
EURINR
Technical Observations:
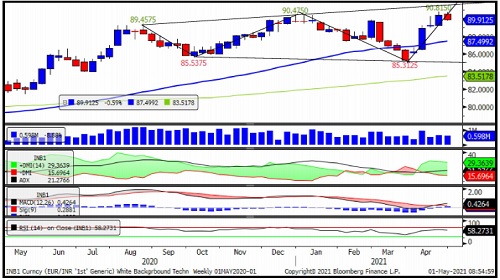
EURINR near month futures formed bearish weekly candle after four bullish candles, on back of profit booking near previous top.
Looking at the pattern, we may see long unwinding/ profit booking in coming weeks.
The pair is forming expanding triangle pattern on weekly chart with higher highs and lower lows. Momentum oscillator, Relative Strength Index of 14 weeks slightly turned week with negative divergence suggesting weakness.
The pair has support at 87.50, the 50 week Moving average and resistance around 92.50.
Monthly Range : 87.50 to 92.50
GBPINR
Technical Observations:
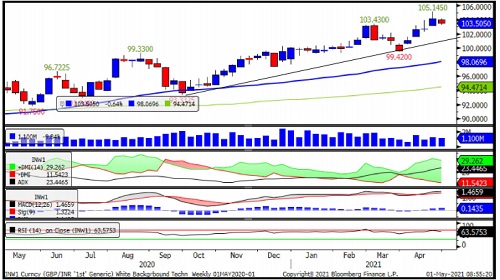
GBPINR near month futures trading with higher highs and lows formation on weekly chart, considered as bullish formation.
The pair is expected to trading with positive bias till it hold the support of 101.80, the upward slopping trend line as shown in the chart.
Momentum oscillator, RS! of 14 weeks hovering near overbought zone and could form the negative divergence it the pair breaks the level of 101.80.
We remain bullish in GBPINR May futures till it holds the support of 101.8 while on higher side we see resistance around 106.50.
Monthly Range : 101.50 to 106.50
JPYINR
Technical Observations:
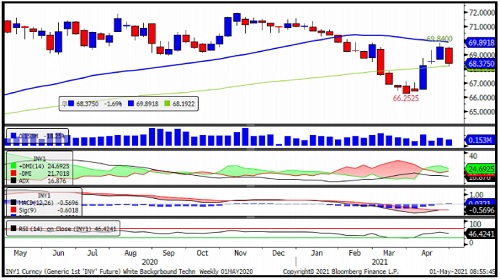
JPYINR futures stuck between 70 to 68 range, the 50 and 100 weeks moving average.
The gap between short term and medium term moving averages narrowing and may give negative cross over considered as bearish signal.
Momentum oscillator, RSI on weekly chart turned down from centre line indicating continuation of weak momentum. MACD and MACD average flatten below zero line.
Short term traders should watch range of 70 to 68 range breakout.
However, the indicators signalling bearish action one should wait for breakout of 68.
Monthly Range : 70 to 66.50
To Read Complete Report & Disclaimer Click Here
Please refer disclaimer at https://www.hdfcsec.com/article/disclaimer-1795
SEBI Registration number is INZ000171337
Views express by all participants are for information & academic purpose only. Kindly read disclaimer before referring below views. Click Here For Disclaimer




Tag News

EURINR trading range for the day is 89.13 - 89.49. - Kedia Advisory


More News

Sell JPYINR MAR @ 55.8 SL 56 TGT 55.6-55.4 - Kedia Advisory


 320-x-100_uti_gold.jpg" alt="Advertisement">


