USDINR March futures resisting at 20 EMA on hourly chart - HDFC Securities

Follow us Now on Telegram ! Get daily 10 - 12 important updates on Business, Finance and Investment. Join our Telegram Channel
Caution Ahead of FOMC Outcomes - HDFC Securities
Asian stocks and currencies are set to open steady Wednesday as investors weigh the strength of the economic recovery ahead of the U.S. Federal Reserve's latest policy comments. There is no change in interest rate decision but market players see a risk that the Fed may not extend the current requirement of the SLR or fail to provide adequate assurance to calm the volatility in bond markets
Indian rupee snaps four day wining streak on Tuesday following risk off tone. Further, some of Indian states started fresh restriction following rise in virus cases which weighed on rupee and equities. We are also witnessing foreign fund outflow from domestic equities and bond ahead of financial year closing. As per the exchange data, global funds remain net seller on March 15, as the bought a net $48 million in debt and sold a net $132.3 million in Indian equities.
On Tuesday, USDINR closed at 72.55 gained 7 paise. The gain was mainly on back of riskaversion and recovery in dollar index ahead of FOMC monetary policy outcome. We expect caution ahead of FOMC outcome. Technically, spot USDINR is in down trend with multiple support in the range of 72.25 to 72 range while 72.98, the 50 DMA remains resistance for the time being.
A gauge of the greenback was steady after swinging between gains and losses, while the euro fell to the lowest level versus the dollar in almost a week amid ongoing concerns about vaccinations and the region’s economic outlook.
US Treasury 10-year yields rose 1.4bps to 1.62%; the 5s30s curve steepened 3.7bps to 156.5bps. Treasuries dropped, with yields hovering near one-year highs. The yield curve briefly pared its steepening after the U.S. sold $24 billion in 20-year securities at the highest auction stop for the maturity since issuance resumed in May
Technical Observations:
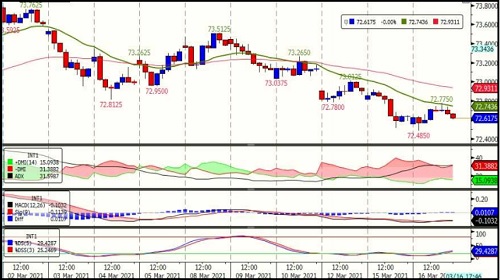
USDINR March futures resisting at 20 EMA on hourly chart. The formation of lower top lower bottom on all time scale suggesting continuation of down trend.
The pair is having resistance at 72.78 and 72.93, the 20 and 55 EMA on hourly chart
Momentum oscillators and indicators remained weak on daily chart while some of the oscillators on hourly chart are oversold indicating short covering bounce in coming days.
Short term traders should remain bearish with any bounce up to 72.93 will be used to make short sell keeping stop loss at 73.26.
USDINR March Daily Chart

To Read Complete Report & Disclaimer Click Here
Please refer disclaimer at https://www.hdfcsec.com/article/disclaimer-1795
SEBI Registration number is INZ000171337
Views express by all participants are for information & academic purpose only. Kindly read disclaimer before referring below views. Click Here For Disclaimer


Tag News

EURINR trading range for the day is 89.13 - 89.49. - Kedia Advisory


