Tightening Waves To Ride The Market - HDFC Securities

Tightening Waves To Ride The Market - HDFC Securities
* Indian rupee marked the fifth monthly decline in a row following foreign fund outflows, surprise rate hikes and risk-averse sentiments. Even after a weaker dollar index, the rupee remained under pressure amid weaker regional currencies, weaker economic data and higher crude oil prices. Surging inflations, slower growth and higher trade deficit all weighed on local units. However, the volatility remained lower and price action remained calm in the second half of May month.
* In May, spot USDINR gained 1.6% to 77.64 while the ICE dollar index fell 1.2% to 101.75. The technical setup suggests bullishness for USDINR and any dip towards 77.10 can be bought for a target of 78 and 78.30.
* June could be the month of make or break after calmness in the last couple of weeks as we have central bank policy decisions from RBI and G-4 countries. Surging bond yields and recent inflation numbers hint hawkish stance from central banks.
* It isn’t so many changes in the interest rate that move the dollar, but the amount of currency spilling around in the market. If you think about the dollar as a commodity, as supply falls and demand remains steady, the greenback will gain. The monetary base is due to shrink in 2022 as the Fed trims the balance sheet. If the divergence widens to match what happened at the beginning of 2014, the dollar should surge.
* In FX, flows skewed towards dollar selling in the week gone. Traders bought 13.3k euro contracts and 5k yen, as well as 6.3k GBP, 5.7k CAD, and 5.7k MXN. All told, the aggregate dollar long fell by $3.4 billion on the week.
USDINR
Technical Observations:
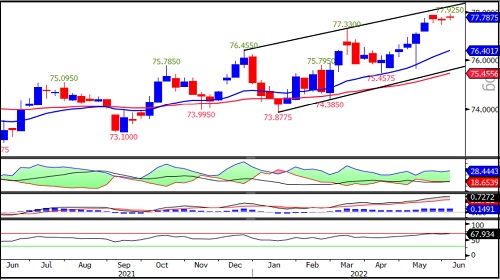
* USDINR June futures formed another Doji Candlestick Pattern on a Weekly chart, suggesting indecisiveness at an upper band.
* The pair has upward sloping channel resistance around 78.30. It has been trading with the higher top higher bottomformation on the Weekly chart.
* Momentum oscillator, Relative Strength Index (RSI) of 14 weeks consolidating around an oversold zone.
* MACD has been placed above the zero line and heading north indicating a bullish trend.
* USDINR June futures is expected to consolidate in the range of 77.50 to 78.20. However, looking at the oscillators, there are chances of on downswing in the current month but that will be buying opportunity.
EURINR
Technical Observations:
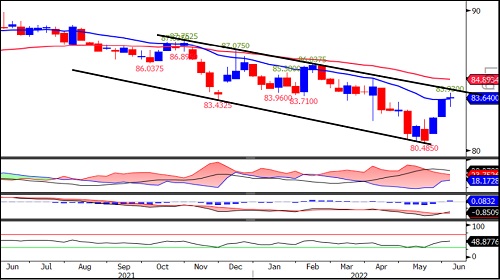
* EURINR June futures closed above 21 weeks exponential moving average but formed a Doji candlestick pattern which is a reversal pattern. Short term traders should watch a candle high of 83.93 and a low of 80.85 for trade.
* The pair is having descending trend line resistance near 84.10, adjoining highs of 87.76, 87.07 and 96.04.
* Momentum oscillator, RSI of 14 weeks started moving north and currently placed at 49 indicating reversal in the short term momentum.
* MACD has given positive cross over and histogram also turned positive indicating strength in trend.
* We believe short term traders can make contrarian sell around 84.30 with stop loss above 85.30 for target of 83 and 82.70.
GBPINR
Technical Observations:
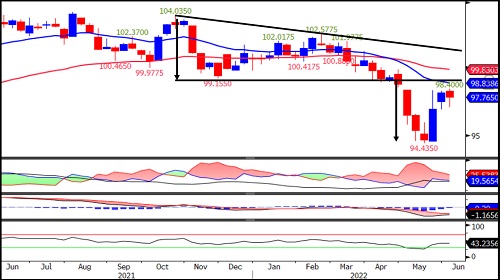
* GBPINR June futures has resistance at 99.15, the previous bottom, highlighted by the horizontal line and 21 weeks exponential moving average.
* After completing the descending triangle, the pair again retraced back to horizontaltrendline resistance.
* Momentum oscillator, RSI exited from an oversold zone and is currently placed at 43 indicating short term reversal.
* Directional Movement Index remained with –DI placed above +DI and ADX line is placed below 25 indicating continuation ofthe downtrend.
* GBPINR June futures is expected to trade with a bearish bias as long as it trades below 99.85 while on the downside hassupport at 95.
JPYINR
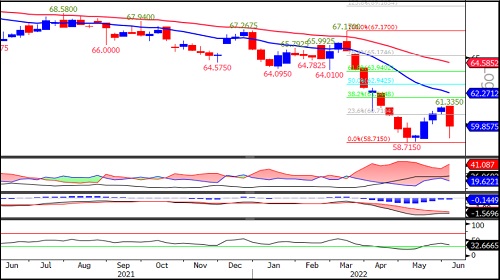
* JPYINR June futures has a resistance of 21 weeks exponential moving average and 38.2% Fibonacci retracement placed at 62.27.
* The pair has been forming a bearish sequence of lower top lower bottom on a weekly chart.
* Momentum oscillator, Relative strength index of 14 weeks heading towards oversold zone after last months rebound indicating continuation of weak momentum.
* MACD has been placed below zero line while histogram bars are small indicating a weak trend.
* Near term bias for JPYINR June futures remain bearish as long as it closes above 62.30 while on the downside it will find support around58.50.
To Read Complete Report & Disclaimer Click Here
Please refer disclaimer at https://www.hdfcsec.com/article/disclaimer-1795
SEBI Registration number is INZ000171337
Views express by all participants are for information & academic purpose only. Kindly read disclaimer before referring below views. Click Here For Disclaimer