The daily strength indicator RSI is gyrating around its reference line indicating lack of momentum on either side - Axis Securities

Follow us Now on Telegram ! Get daily 10 - 12 important updates on Business, Finance and Investment. Join our Telegram Channel
Nifty
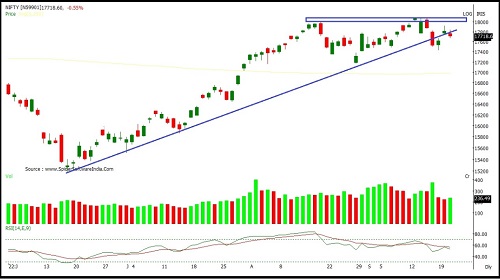
Nifty opened sharply lower with a downward gap and traded with extreme volatility throughout the session to close on a negative note. Nifty closed at 17718 with a loss of 98 points.
On the daily chart the index has formed a small Bearish candle with shadows on either side indicating indecisiveness amongst participants regarding the direction. Index is holding above its 20SMA from past two trading sessions placed at 17700, which will be a crucial level to watch out for. The index is moving in a Higher Top and Higher Bottom formation on the daily chart indicating a sustained up trend. The chart pattern suggests that if Nifty crosses and sustains above 17800 level it would witness buying which would lead the index towards 17900-18000 levels. Important support for the day is around 17600 However if index sustains below 17600 then it may witness profit booking which would take the index towards 17500- 17400 levels.. Nifty is trading above 20, 50, 100 and 200 day SMA indicating positive bias in the short to medium term. Nifty continues to remain in an uptrend for the short term, so buying on dips continues to be our preferred strategy. The daily strength indicator RSI continues to remain flat and is below its reference line indicating absence of momentum on either side
The trend deciding level for the day is 17740. If NIFTY trades above this level then we may witness a further rally up to 17815-17915-17990 levels. However, if NIFTY trades below 17740 levels then we may see some profit booking initiating in the market, which may correct up to 17640-17565-17465 levels.
Banknifty
Banknifty opened with a downward gap and traded with extreme volatility on either side to close on a negative note. Banknifty closed at 41203 with a loss of 265 points.
On the daily chart the index has formed a small Bearish candle with shadows on either side indicating indecisiveness amongst participants regarding the direction. The index is moving in a Higher Top and Higher Bottom formation on the daily chart indicating a short term up trend. The chart pattern suggests that if Banknifty crosses and sustains above 41500 level it would witness buying which would lead the index towards 41700-41900 levels. Important support for the day is around 41000 However if index sustains below 41000 then it may witness profit booking which would take the index towards 40900- 40700 levels.. Banknifty is sustaining above its 20, 50, 100 and 200- day SMA which signals bullish sentiments in near term. Banknifty continues to remain in an uptrend in the medium and long term, so buying on dips continues to be our preferred strategy.
The daily strength indicator RSI is gyrating around its reference line indicating lack of momentum on either side.
The trend deciding level for the day is 41450. If BANK NIFTY trades above this level then we may witness a further rally up to 41695-41920-42165 levels. However, if BANK NIFTY trades below 41450 levels then we may see some profit booking initiating in the market, which may correct up to 41225- 40980-40755 levels.

To Read Complete Report & Disclaimer Click Here
For More Axis Securities Disclaimer https://simplehai.axisdirect.in/disclaimer-home
SEBI Registration number is INZ000161633
Views express by all participants are for information & academic purpose only. Kindly read disclaimer before referring below views. Click Here For Disclaimer


Top News

Only decentralised renewable energy can help achieve 2030 targets as promised by Prime Minis...


More News

Nifty Futures closed at a premium of 101 points compared to the previous day premium of 116 ...