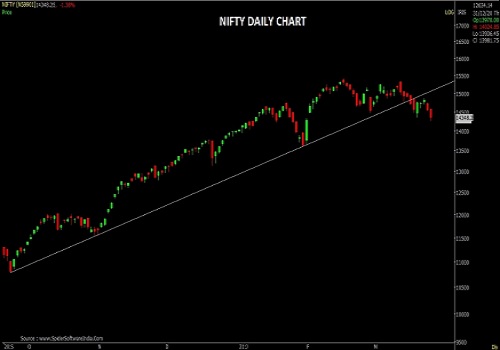
The chart pattern suggests that if Nifty crosses and sustains above 14500 level -

Follow us Now on Telegram ! Get daily 10 - 12 important updates on Business, Finance and Investment. Join our Telegram Channel
https://t.me/InvestmentGuruIndiacom
Download Telegram App before Joining the Channel
Nifty
Nifty opened with an upward gap but witnessed selling from the opening tick to end near the day's low. Nifty closed at 14325 with a loss of 225 points. On the daily chart the index has formed a long Bearish candle forming lower High- Low compare to previous session indicating negative bias. The chart pattern suggests that if Nifty crosses and sustains above 14500 level it would witness buying which would lead the index towards 14575- 14675 levels. However if index breaks below 14260 level it would witness selling which would take the index towards 14000-13960.
To Read Complete Report & Disclaimer Click Here
Please refer disclaimer at https://jainam.in/
SEBI Registration No.: INZ000198735, Research Analyst: INH000006448, PMS: INP000006785
Views express by all participants are for information & academic purpose only. Kindly read disclaimer before referring below views. Click Here For Disclaimer


Tag News

Nifty opened with an upward gap and witnessed consolidation for most part of the session - J...