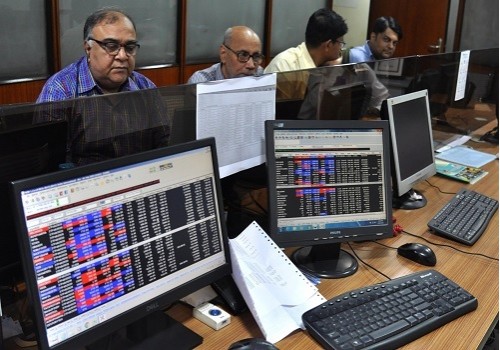
The chart pattern suggests that if Nifty breaks and sustains below 18900 level - Jainam Share Consultants

Nifty
Nifty opened with an upward gap and remained in positive terrain throughout the day. Nifty closed at 18972 with a gain of 155 points. On the daily chart the index has formed a long Bullish candle forming higher High-Low formation indicating positive bias. The chart pattern suggests that if Nifty breaks and sustains below 18900 level it would witness selling which would lead the index towards 18800-18700 levels. However if index crosses above 19015 level it would witness pullback rally which would take the index towards 19050-19100

To Read Complete Report & Disclaimer Click Here
PleasTe refer disclaimer at https://jainam.in/
SEBI Registration No.: INZ000198735, Research Analyst: INH000006448, PMS: INP000006785
Views express by all participants are for information & academic purpose only. Kindly read disclaimer before referring below views. Click Here For Disclaimer


Top News

Employable percentage of final-year, pre-final year students reach 51.3 pc in 10 years: Centre
Tag News

Weekly Market Analysis : Markets strengthened recovery and gained nearly 2% in the passing w...


More News

The index confirmed the bearish trend with a gap sequence of a `Breakaway Gap` followed by a...


