The Nifty trend deciding level for the day is 16015 - Axis Securities

Follow us Now on Telegram ! Get daily 10 - 12 important updates on Business, Finance and Investment. Join our Telegram Channel
https://t.me/InvestmentGuruIndiacom
Download Telegram App before Joining the Channel
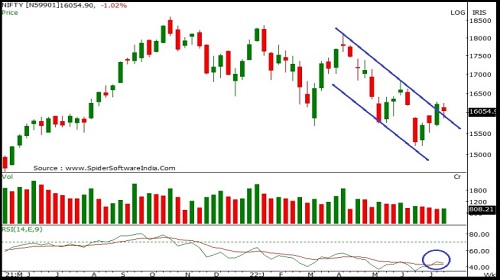
Nifty
Nifty started the week on a flat note and traded with extreme volatility on either side throughout the week.However Friday's buying momentum recovered some of the earlier losses to close in negative terrain. Nifty closed at 16049 with a loss of 171 points on a weekly basis. On the weekly chart the index has formed a "Doji" candlestick formation indicating indecisiveness amongst market participants regarding the direction. The index is moving in a Lower Top and Lower Bottom formation on the weekly chart indicating negative bias. The chart pattern suggests that if Nifty crosses and sustains above 16100 level it would witness buying which would lead the index towards 16300-16600 levels. However if the index breaks below 15800 level it would witness selling which would take the index towards 15600-15400. Nifty is now well placed above its 20 and 50 Day SMA indicating positive bias in the short term. Nifty continues to remain in an uptrend in the medium term, so buying on dips continues to be our preferred strategy. For the week, we expect Nifty to trade in the range of 16500-15800 with a positive bias. The weekly strength indicator RSI is moving upwards and is quoting above its reference line indicating positive bias. The trend deciding level for the day is 16015. If NIFTY trades above this level then we may witness a further rally up to 16100-16155-16240 levels. However, if NIFTY trades below 16015 levels then we may see some profit booking initiating in the market, which may correct up to 15960-15875-15820 levels.
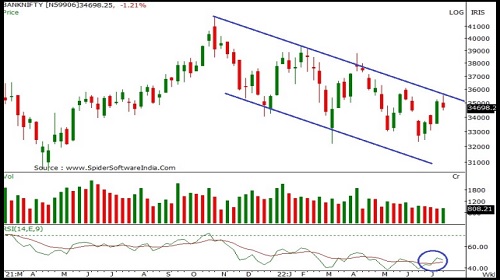
Bank Nifty
Bank Nifty started the week on a flat note however profit booking for most of the week led the index to end on a weak note. Bank Nifty closed at 34683 with a loss of 441 points on a weekly basis. On the weekly chart the index has formed a Bearish candle with a long upper shadow indicating selling and resistance at higher levels. The index is moving in a Lower Top and Lower Bottom formation on the weekly chart indicating negative bias. The chart pattern suggests that if Bank Nifty crosses and sustains above 35000 level it would witness buying which would lead the index towards 35400-36000 levels. However if the index breaks below 34300 level it would witness selling which would take the index towards 34000-33500. Bank Nifty is trading above the 20 and 50 day SMA which are important short term moving averages, indicating positive bias in the short term. Bank Nifty continues to remain in a downtrend in the short to medium term, so selling on rallies continues to be our preferred strategy. For the week, we expect Bank Nifty to trade in the range of 35500-34000 with a positive bias. The weekly strength indicator RSI is moving upwards and is quoting above its reference line indicating positive bias. The trend deciding level for the day is 34680 If BANKNIFTY trades above this level then we may witness a further rally up to 34900-35120-35335 levels. However, if BANKNIFTY trades below 34680 levels then we may see some profit booking initiating in the market, it may correct up to 34465-34245-34030 levels.
To Read Complete Report & Disclaimer Click Here
For More Axis Securities Disclaimer https://simplehai.axisdirect.in/disclaimer-home
SEBI Registration number is INZ000161633
Views express by all participants are for information & academic purpose only. Kindly read disclaimer before referring below views. Click Here For Disclaimer


More News

Market Quote : The better-than-expected US Q2 GDP data, though positive Says Mr. Vinod Nair,...