The Nifty started the session with a negative gap (17201-17073). However - ICICI Direct

Follow us Now on Telegram ! Get daily 10 - 12 important updates on Business, Finance and Investment. Join our Telegram Channel
Nifty : 17038
Technical Outlook
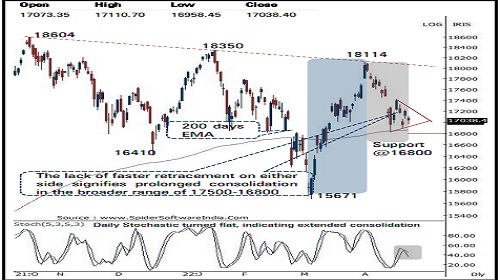
• The Nifty started the session with a negative gap (17201-17073). However, supportive efforts from the psychological mark of 17000 helped index to recover some of intraday losses. As a result, daily price action formed a bear candle with lower shadow, highlighting supportive efforts from lower band of consolidation. In the process, broader market relatively outperformed the benchmark
• Key point to highlight is that past seven sessions roller coaster move has been taking shape of a contracting triangle pattern while discounting Q4FY22 earnings and volatile global cues. Thus, we believe a decisive close on the either side of the range would dictate the further course of action in coming sessions. Till then, prolonging of consolidation amid stock specific action would prevail. The ongoing consolidation has helped weekly stochastic oscillator to cool off the overbought conditions and make market healthy. Hence, dips should be capitalized to accumulate quality stocks in a staggered manner as long as Nifty sustains above 16800. On the upside, 17500 will continue to act as immediate resistance for the Nifty as it is confluence of:
• a) bearish gap recorded on April 18, 2022 placed in the range of (17475-17238)
• b) 50% retracement of April decline (18114-16825)
• Structurally, the formation of higher trough on the weekly chart signifies broader positive structure is intact which in turn indicates that the strong support base is placed at 16800 as it is confluence of:
• A) 50% retracement of the entire March 2022
• B) 200 days EMA placed at 16850
• The broader market indices are consolidating in the vicinity of 200 days EMA. We believe, base formation from hereon would set the stage for next leg of up move amid ongoing Q4FY22 earning season In the coming session, we expect index to continue with its northbound activity amid positive bias wherein volatility would remain high owing to monthly derivative expiry. Hence, use intraday dip towards 16980-17012 for creating long position for the target of 17098
NSE Nifty Daily Candlestick Chart
Nifty Bank: 36028
Technical Outlook
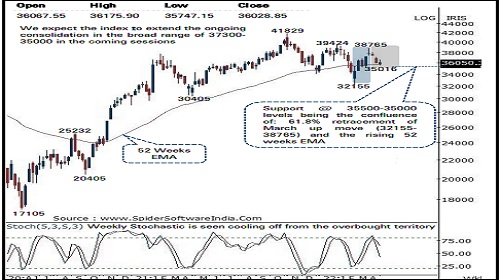
• The daily price action formed a second consecutive high wave candle signaling continuation of the consolidation as lack of follow through in either direction ahead of the Monthly F&O expiry and the US FOMC meeting schedule next week
• Going ahead, we expect the index to trade with positive bias while extending the ongoing consolidation in the broad range of 35000 -37300 levels amid stock specific activity as indicated by lack of faster retracement on either side
• On the higher side 37300 is likely to act as major hurdle being the confluence of the last Monday’s gap down area and the 50 % retracement of recent decline (38765 -35511 )
• Structurally, the current corrective decline is shaping out as a retracement of strong 20 % rally from March 2022 lows (32156 ) which will help the index to work out of overbought conditions in the weekly time frame . We expect the index to hold above the strong support area of 35500 -35000 levels as it is confluence of :
• (a) 61 . 8 % retracement of the entire March 2022 up move (32155 -38765 ) placed at 34800 levels
• (b) The rising 52 weeks EMA is also placed around 35500 levels
• (c ) The recent swing low of second half of March 2022 is also placed around 35000 levels
• Among the oscillators the weekly stochastic is seen cooling off from the overbought territory and is currently placed at a reading of 43 indicating prolongation of the current consolidation
In the coming session, index is likely to open on a flat note tracking mixed global cues . We expect the index to trade in a range with high volatility on account of the monthly expiry . Bias remain positive, hence use intraday dips towards 35820 -35890 for creating long position for the target of 36140 , maintain a stoploss at 35710
Nifty Bank Index – Weekly Candlestick Chart
To Read Complete Report & Disclaimer Click Here
https://secure.icicidirect.com/Content/StaticData/Disclaimer.html
Above views are of the author and not of the website kindly read disclaimer


Tag News

Stock Picks : TCS Ltd And Chambal Fertiliser Ltd By ICICI Direct


More News

Daily RSI Divergence, Support Levels Indicate Weakening Bearish Momentum - Tradebulls Securi...