Relative strength of Banknifty is higher than Nifty on daily and weekly charts - HDFC Securities

Follow us Now on Telegram ! Get daily 10 - 12 important updates on Business, Finance and Investment. Join our Telegram Channel
https://t.me/InvestmentGuruIndiacom
Download Telegram App before Joining the Channel
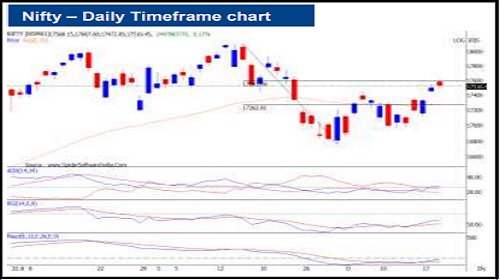
Daily Technical View on Nifty
* After surpassing crucial resistance of 17428, Nifty has been sustaining above it
* Previous top of 17428 is likely to act as a support for he short term
* Nifty has retraced more than 61.8% of the entire downswing seen from 18096 to 16747
* Trend of the Nifty is bullish as it has made higher top preceded by higher bottom and Index has also been holding above important moving averages.
* Oscillators and Indicators have turned bearish on hourly chart of Nifty, which could lead to small correction in overall uptrend
* However, on daily charts indicators and oscillators have been holding strength
* Considering the overall trend dips should be utilized to initiate fresh longs
* Support zone of 17400-17450 is ideal level to go long with 17200 stoploss in Nifty.
* Relative strength of Banknifty is higher than Nifty on daily and weekly charts
To Read Complete Report & Disclaimer Click Here
Please refer disclaimer at https://www.hdfcsec.com/article/disclaimer-1795
SEBI Registration number is INZ000171337
Views express by all participants are for information & academic purpose only. Kindly read disclaimer before referring below views. Click Here For Disclaimer


Tag News

Nifty registers best week in 2 months after rising for 6 consecutive sessions