In the coming session, index is likely to open on a positive note tracking firm global cues - ICICI Direct

Follow us Now on Telegram ! Get daily 10 - 12 important updates on Business, Finance and Investment. Join our Telegram Channel
Nifty : 16416
Technical Outlook
• The index witnessed a lacklustre session post gap down opening. Consequently, the Nifty filled last week’s positive gap (16352-16438). The daily price action formed a small bear candle carrying lower high-low, indicating extended breather. In the process, NSE daily cash turnover (|42300 crores) remained below its one month average of |56000 crores, indicating lack of participation ahead of RBI’s monetary policy
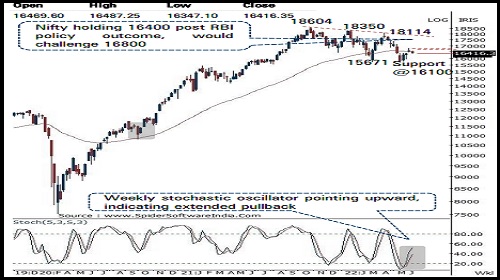
• The index has been sustaining above lower band of past six sessions consolidation range of 16800-16400, highlighting supportive efforts at earlier range breakout zone of 16400, as per change of polarity concept. Going ahead, if the Nifty holds above 16400 post RBI policy outcome, that coupled with a decisive close above previous session’s high (16487) would lead the Nifty to challenge higher band of past one week’s consolidation at 16800 in coming sessions. Failure to do so would lead to prolonging of consolidation amid stock specific action
• Structurally, over past six sessions index has retraced 38.2% of preceding 3 sessions up move (15903-16695). The slower pace of retracement signifies elevated buying demand that makes us confident to retain support base at 16100 as it is 61.8% retracement of current up move (15735-16793)
• Broader market indices are mirrored the benchmark move and reacted from the upper band of past three weeks range. Going ahead, a decisive close above last week’s high would confirm range breakout that would open the door for extension of pullback in Nifty midcap and small cap indices. Failure to do so would lead to prolongation of range bound activity wherein broader market would undergo a base formation
In the coming session, index is likely to open on a positive note tracking firm global cues. We expect index to trade with a positive bias while sustaining above Tuesday’s low of 16354. Hence, use intraday dip towards 16386-16412 for creating long position for the target of 16499
NSE Nifty Daily Candlestick Chart
Nifty Bank: 34996
Technical Outlook
• The daily price action formed a bear candle with a lower high -low signaling range bound trade with corrective bias for the sixth consecutive sessions . Index in the last six sessions has retraced only 38 . 2 % of its preceding eight sessions strong up move (33180 -36083 ) . A shallow retracement signals positive bias and a higher base formation . Volatility is likely to be high in the coming session on account of the RBI monetary policy outcome
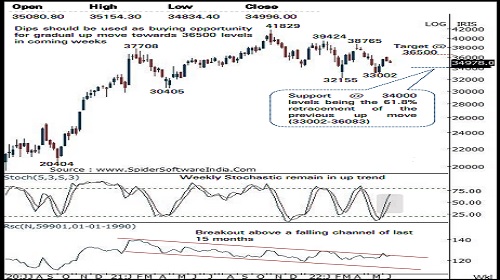
• Going ahead, we expect the index to hold above the key support area of 34000 , hence the current breather should not be seen as negative instead dips towards 34000 -34500 levels should be used as a buying opportunity for gradual up move towards 36500 levels being the 61 . 8 % retracement of the April -May decline (38765 -33002 ) • Key observation in the recent market correction is that Bank Nifty is relatively outperforming the Nifty and the Bank Nifty/Nifty ratio chart has registered a breakout above its last 15 months falling channel highlighting strength and continuation of the current outperformance
• The index has key support around 34000 levels as it is the 61 . 8 % retracement of the previous up move (33002 -36083 ) placed at 34100 levels
• Among the oscillators the weekly stochastic remain in uptrend thus supports the overall positive bias in the index in the coming weeks
In the coming session, index is likely to open on a positive note amid firm global cues . Index holding above 34800 post RBI policy would lead to a pullback . Hence after a positive opening use intraday dips towards 34900 -34980 for creating long position for the target of 35230 , maintain a stoploss at 34790
Nifty Bank Index – Weekly Candlestick Chart
To Read Complete Report & Disclaimer Click Here
https://secure.icicidirect.com/Content/StaticData/Disclaimer.html
Above views are of the author and not of the website kindly read disclaimer


Tag News

Stock Picks : TCS Ltd And Chambal Fertiliser Ltd By ICICI Direct