320-x-100_uti_gold.jpg" alt="Advertisement">

08-10-2020 10:22 AM | Source: Kedia Advisory

Harmonic Trade Opportunity In Lead - Kedia Advisory
Follow us Now on Telegram ! Get daily 10 - 12 important updates on Business, Finance and Investment. Join our Telegram Channel
Technical Update:
* Lead forms a bearish harmonic pattern on daily chart.
* Lead forms a Bollinger Bands inside bar pattern on daily chart indicating its bearish reversal.
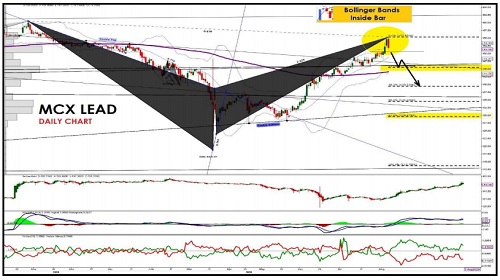
SELL LEAD AUG BELOW 151.20 SL ABV 156 TGT 145-139.60. CMP: 151.20. MCX
To Read Complete Report & Disclaimer Click Here
Views express by all participants are for information & academic purpose only. Kindly read disclaimer before referring below views. Click Here For Disclaimer
Latest News

Women investors in Indian mutual fund industry grow ...

Apple`s Vision Pro shipments doubled in Q3, AR glass...

India`s current account deficit to remain in 1.2-1.5...

Indian share markets to remain range-bound after fla...

Weekly Market Outlook: Due to a lack of significant ...

NTPC and CCTE to advance Thorium-based ANEEL? Fuel f...

Funding booster: Indian startups see 20 pc jump at $...

Weekly Note : The markets witnessed consolidation la...

OpenAI`s o3 reasoning model ignites AI hype among to...

NMDFC disburses over Rs 9,228 crore to 24.84 lakh be...