Gold rose more than 1% to around $1,890 an ounce on Friday - Swastika Investmart Ltd

Follow us Now on Telegram ! Get daily 10 - 12 important updates on Business, Finance and Investment. Join our Telegram Channel
FUNDAMENTALS OF COMMODITY:
* Gold rose more than 1% to around $1,890 an ounce on Friday, rebounding from an over 2- 1/2-week low of $1,859 hit earlier in the session, in reaction to weaker-than-expected US jobs growth, which also pushed the dollar and Treasury yields sharply lower. The precious metal has played a crucial role as an inflation-hedging asset as investors moved to price in a roaring comeback for the US economy and increased inflation. Still, the precious metal dropped approximately 0.6% this week, its largest weekly decline since March.
* Silver gained more than 1% to trade above $27 an ounce on Friday, recovering from early losses, amid a general dollar retreat after the jobs report showed the US economy added fewer jobs than expected in May, easing fears of an early Fed tapering. On the week, silver ended nearly 0.5% lower as investors continue to digest prospects of a strong recovery, inflation fears and chances central banks around the world and especially the Fed could pull monetary stimulus soon.
* Crude oil futures extended the weekly gain to almost 5% on Friday to trade above $69.4 a barrel for the first time since October 2018 and following a 4.3% gain in the previous week amid signs of strong post-pandemic economic recovery. On the supply side, API reported a fall of 5.36 million barrels in US stockpiles last week and EIA data showed a bigger-than-expected 5.08 million drop. Meanwhile, the Saudi Arabian energy minister said it would be premature to talk
Technical indicators (Daily):
* RSI- 56.4932
* MACD- 446.405
* MOVING AVERAGES (20,50,100)- (48433/47316/46991)
MCX GOLD CHART
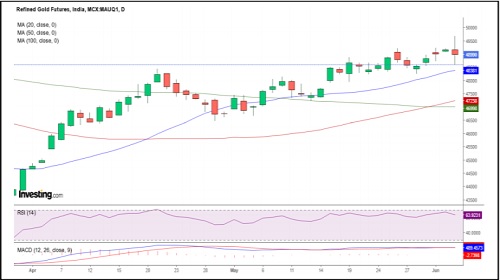
Technical indicators (Daily):
* RSI- 69.9105
* MACD- 82.6299
* MOVING AVERAGES (20,50,100)- (4825/4700/4506)
MCX CRUDE OIL CHART
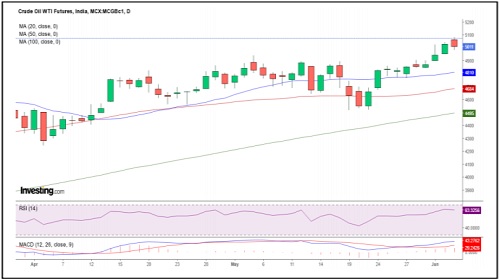
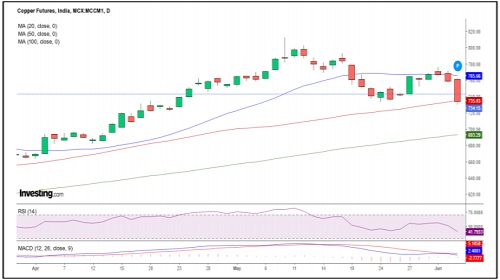
Technical indicators (Daily):
* RSI- 45.9012
* MACD- 1.1747
* MOVING AVERAGES (20,50,100) - (763.5/736.7/694.6)
MCX COPPER CHART
To Read Complete Report & Disclaimer Click Here
Please refer disclaimer at https://www.swastika.co.in/disclaimer
Views express by all participants are for information & academic purpose only. Kindly read disclaimer before referring below views. Click Here For Disclaimer