GBPINR February futures held the support of 21 days exponential moving average - HDFC Securities

Forex markets to remain volatile on US Russia Talks - HDFC Securities
Indian rupee turned bullish in the week gone and erased previous week’s losses on expectation of better foreign fund inflows, lower dollar index and crude oil prices. Spot USDINR plunged 72 paise or 0.95% to 74.66. Technical set up has turned bearish with pair falling below previous bottom and short term moving average. The pair is having support at 74.30 and resistance at 75.50.
India’s foreign exchange reserves declined by $1.763 billion to $630.19b in the week ended on Feb.11 from previous week’s 631.95b.
Risk assets sank while bonds rallied as haven seekers sought refuge ahead of the potential risk from the standoff between the West and Russia
The Bloomberg J.P. Morgan Asia Dollar index hit its highest level since September, and it’s only partly due to the offshore yuan climbing to a three-year high. The Indian rupee is advancing amid lower oil prices, while the Thai baht posted a fresh five-month high before paring overbought gains. Technically, the index has broken a descending trend-line, and is trading above the upper edge of an eight-month channel. A move above the September highs points to further gains, albeit the pace may be slow.
Elsewhere, a tight oil market could soon be lubricated by Iranian oil, even as Ukraine steals the headlines for the short term. That’s probably why bullish momentum is already seeping out of crude. Both WTI and Brent are poised to close lower on a weekly basis for the first time since last year.
In FX, flows were mixed. Specs bought euros (8.7k), sterling (10.8k), on the other hand, yen saw decent selling (7k) with aggregate dollar long fell by roughly $1.2 billion on the week.
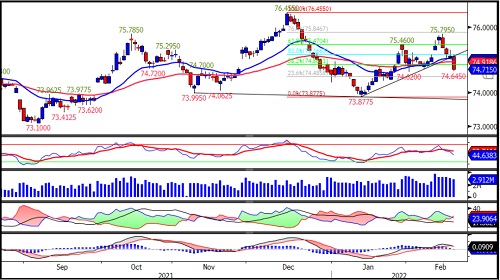
USDINR
USDINR February futures has formed bearish engulfing candlestick pattern on weekly chart. It has also broken the ascending trend line support, adjoining previous swing lows suggesting near term weakness.
The short term moving average placed below medium term moving averages indicating weaker trend.
Momentum oscillators, Relative Strength Index of 14 days exited from overbought zone and placed below 50 with downward direction indicating bearish momentum.
Long unwinding has been seen with fall in price, open interest and volumes.
Short term bias turns bearish and any upswing towards 75.50 will be selling opportunity with lower side target of 74.20. While closing above 75.75 will negate the bearish view.
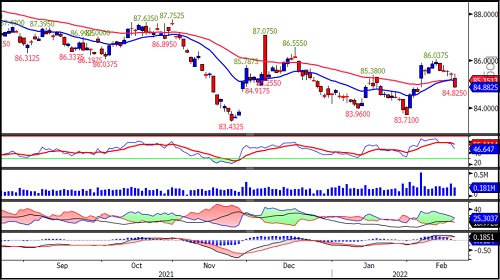
EURINR
EURINR February futures closed below medium term moving averages, the first sign of weakness. However, it had formed higher highs and yet to form higher high.
Momentum oscillator, Relative Strength Index of 14 days reversed before entering overbought zone and currently placed below 50 with negative cross over of average RSI indicating weaker momentum.
MACD has given negative cross over and heading lower indicating weaker trend.
DMI turned weak with +DI and –DI adjoin at centre line.
Long unwinding has been seen with fall in price, volume and open interest.
EURINR February futures expected to trade with negative bias aiming at 84 odd levels while 85.80 remains resistance.
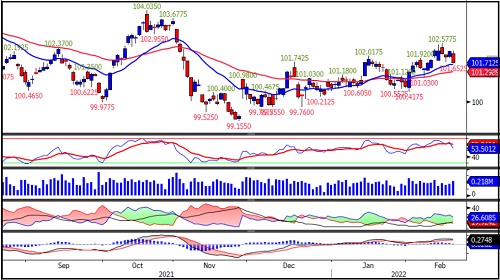
GBPINR
GBPINR February futures held the support of 21 days exponential moving average.
The short term moving averages placed above medium term moving averages suggesting short term up trend.
Formation of higher top higher bottom on daily and hourly chart supporting bullishness.
Directional Movement index showing strength with +DI placed above –DI and ADX line heading north.
Momentum oscillator, RSI has been placed above 50 level indicating positive momentum.
GBPINR February futures expected to trade higher with near term resistance at 102.60 and crossing of the same will open 103 odd level while falling below 101 negates bullish view.
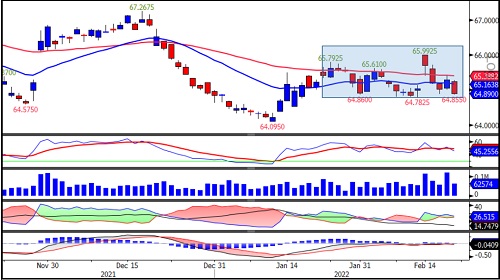
JPYINR
JPYINR February futures has been stuck in broad range of 64.75 to 66, as showing in chart.
The pair has been oscillating around 55 Days exponential moving averages. The pair has been placed below short term moving averages.
Momentum oscillator, Relative strength index has been oscillating around 50 odd levels and currently placed at 45.
MACD has been placed near zero line with negative cross over indicating weaker trend.
Looking at the above technical evidences, the pair has been in consolidation zone with lower side support around 64.75 and resistance around 66.
JPYINR February futures expected to trade within the range of 64.50 to 66 in coming days
To Read Complete Report & Disclaimer Click Here
Please refer disclaimer at https://www.hdfcsec.com/article/disclaimer-1795
SEBI Registration number is INZ000171337
Views express by all participants are for information & academic purpose only. Kindly read disclaimer before referring below views. Click Here For Disclaimer