Equity benchmarks snapped their five week’s losing streak amid volatile global cues - ICICI Direct

Follow us Now on Telegram ! Get daily 10 - 12 important updates on Business, Finance and Investment. Join our Telegram Channel
Week that was…
Equity benchmarks snapped their five week’s losing streak amid volatile global cues. The Nifty ended the week at 16266, up 3.1%. Broader markets indices performed in tandem with the benchmark as Nifty midcap and small cap surged 2.9% and 3.75%, respectively. Sectorally, barring IT, all major indices ended in green led by metal, auto, FMCG.
Technical Outlook
• The index started the week on a positive note and subsequently witnessed a roller coaster move as the Nifty oscillated by 1700 points during the week. Consequently, weekly price action resembles Tweezer bottom candlestick formation carrying strikingly opposite coloured candle with identical lows, indicating supportive efforts emerged from March lows of 16700 amid oversold conditions
• Going forward, cool off in volatility will help Nifty to surpass the immediate hurdle of 16400 levels and eventually pave the way to head towards 16800 in coming weeks. However, move towards 16800 would be in a nonlinear fashion. Hence, buying dips towards 15800- 16000 would be rewarding as host of negative news are getting priced in. In the process, we do not expect the Nifty to breach the key support threshold of 15600. Our target of 16800 is based on following observations:
• a) 200 day’s EMA placed at 16780 B) 50% retracement of the entire April-May decline (18115-15735)
• Sectorally, Auto, Metal, BFSI and capital goods stocks provide favourable risk-reward at current juncture
• In large caps, we prefer Reliance industries, SBI, Kotak bank, ITC, Maruti Suzuki, Hindalco, Cipla while in midcaps we prefer ABB, Ashok Leyland, Apollo Tyres, Automotive Axles, Hindustan Aeronautics, Indian Hotel, PVR, Tata Chemicals, SRF, NMDC, Elecon Engineering
• Structurally, over past two decades, on 16 out of 20 occasions despite transitory breach (not greater than 5%) of 52-week EMA (currently 16600) index has generated decent returns in subsequent 3 month and 6 months. In current scenario 5% from 52 weeks EMA is placed at 15700 which has been held on multiple occasions over past two weeks. We expect this rhythm to be maintained as strong support is placed in the range of 15600-15400 as it is confluence of:
• A) 61.8% retracement of CY21 rally B) equality of previous down leg of 14% projected from April high of 18115
• In tandem with the benchmark broader market staged a pullback from oversold territory. Going ahead, we expect Nifty midap index to undergo base formation in the vicinity of 52 weeks EMA while sustaining above March low.
• In the coming session, index is likely to open on a flat note tracking mixed global cues. We expect index to consolidate with a positive bias while sustaining above . Hence, use intraday dip towards 16120- 16152 for creating long position for the target of 16238
Nifty Bank Index – Weekly Candlestick Chart
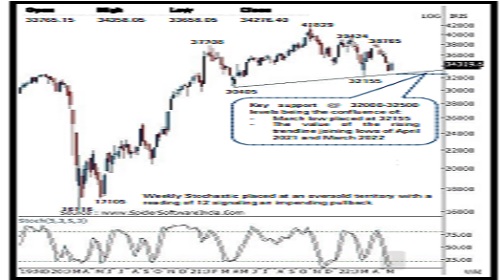
Nifty Bank: 34276
Technical Outlook
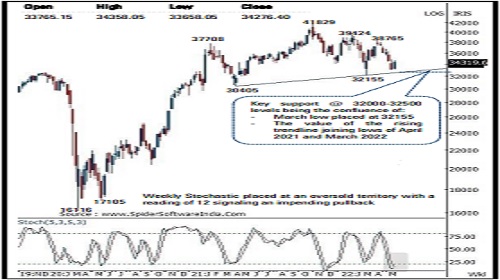
• The weekly price action resembles Tweezer bottom candlestick formation carrying strikingly opposite colored candle with identical lows signaling support around 33000 levels . The price action remained contained inside previous week high -low range highlighting base formation after the recent sharp decline .
• Going ahead, we expect the index to surpass above last two week’s highs (34793 ) and head towards 36000 levels in the coming weeks . However, we expect the move towards 36000 would be in a nonlinear fashion . Buying on dips towards 33000 -33300 levels should be rewarding as strong support exist around 32000 levels
• Our target of 36000 is based on following observations being the confluence of the 200 days EMA (placed at 35948 ) and the 50 % retracement of the entire recent decline (38765 -33002 )
• The index has key support placed around 32000 -32500 levels as it is :
• (a) March low placed at 32155
• (b) The value of the rising trendline joining lows of April 2021 (30405 ) and March 2022 (32155 )
• Among the oscillators the weekly stochastic is placed at an extreme oversold territory with a reading of 12 signaling an impending pullback in the coming weeks . In the coming session, index is likely to open on a flat note amid mixed Asian cues . We expect it to trade in a range with positive bias while holding above 34000 levels . Hence, use intraday dips towards 33960 -34030 for creating long positions for targe of 34290 , maintain a stoploss at 33840
Nifty Bank Index – Weekly Candlestick Chart
To Read Complete Report & Disclaimer Click Here
https://secure.icicidirect.com/Content/StaticData/Disclaimer.html
Above views are of the author and not of the website kindly read disclaimer




Tag News

Stock Picks : TCS Ltd And Chambal Fertiliser Ltd By ICICI Direct


More News
View on Bank Nifty : The Bank index witnessed selling pressure from higher levels Says Kunal...
