320-x-100_uti_gold.jpg" alt="Advertisement">

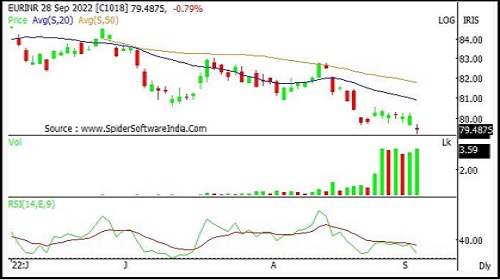
EURINR opened with downward gap and remained extreme volatile throughout the session - Axis Securities

Follow us Now on Telegram ! Get daily 10 - 12 important updates on Business, Finance and Investment. Join our Telegram Channel
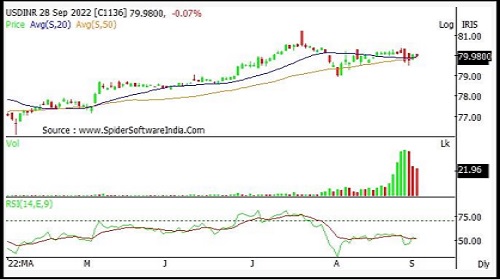
USDINR
USDINR opened with a downward gap and remained in a small range throughout the day. USDINR closed at 79.98 with a loss of 0.07 %. On the daily chart USDINR has formed a bearish candle however it remained restricted within previous session's HighLow range indicating absence of strength on either side USDINR continue to move in past couple of trading session's High-Low range representing lackluster movement. USDINR is trading below 20 and 50 day SMA's which are important short term moving averages, indicating negative bias in the short to medium term The chart pattern suggests that if USDINR breaks and sustains below 79.70 level it would witness selling which would lead USDINR towards 79.50-79.30 levels. Important Resistances for the day are placed at 80.10. The daily strength indicator RSI and momentum oscillator Stochastic have both turned negative and are below their respective reference lines indicating negative bias

EURINR
EURINR opened with downward gap and remained extreme volatile throughout the session.. EURINR closed at 79.48 with a loss of 0.79 %. On the daily chart EURINR has formed a sizable Bearish candle forming lower Highlow compare to previous session and has closed below previous session's low indicating negative bias EURINR is moving in a Lower Top and Lower Bottom formation on the hourly chart indicating short term downtrend. EURINR is trading below 20 and 50 day SMA's which indicating negative bias in the short term The chart pattern suggests that if EURINR crosses and sustains above 79.70 level it would witness buying which would lead EURINR towards 79.90-78.10 levels. However if EURINR breaks below 79.20 level it would witness selling which would take EURINR towards 79-78.80. The daily strength indicator RSI and momentum oscillator Stochastic have both turned negative and are below their respective reference lines indicating negative bias
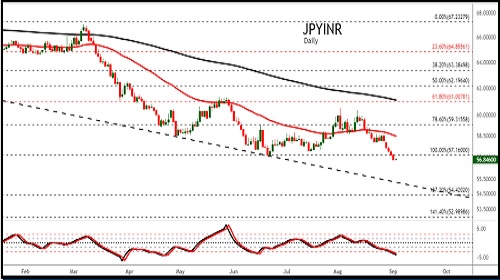
JPYINR
JPYINR opened with a downward gap and remained negative throughout the day. JPYINR closed at 57.07 with a loss of 0.19 %. On the daily chart JPYINR has formed a bearish candle however it remained restricted within previous session's HighLow range indicating absence of strength on either side JPYINR is moving in a Lower Top and Lower Bottom formation on the daily chart indicating sustained down trend. JPYINR is trading below 20 and 50 day SMA's which are important short term moving averages, indicating negative bias in the short to medium term The chart pattern suggests that if JPYINR breaks and sustains below 57.05 level it would witness selling which would lead JPYINR towards 56.85-56.70 levels. Important Resistances for the day are placed at 57.40-57.60. The daily strength indicator RSI and momentum oscillator Stochastic have both turned negative and are below their respective reference lines indicating negative bias
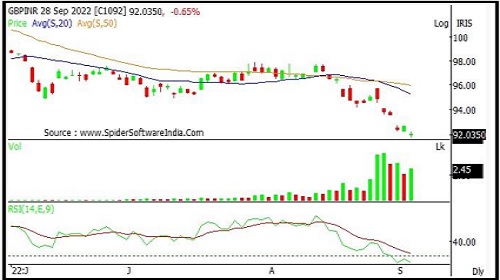
GBPINR
GBPINR opened with a downward gap and remained in a small range throughout the day. GBPINR closed at 92.03 with a loss of 0.65 %. On the daily chart GBPINR has formed a small Bullish candle forming lower High-Low compare to previous session indicating negative bias GBPINR is moving in a Lower Top and Lower Bottom formation on the daily chart indicating sustained down trend. GBPINR is trading below 20 and 50 day SMA's which indicating negative bias in the short term The chart pattern suggests that if GBPINR breaks and sustains below 91.70 level it would witness selling which would lead GBPINR towards 91.50-91.30 levels. Important Resistances for the day are placed at 92.45-92.65. The daily strength indicator RSI and momentum oscillator Stochastic have both turned negative and are below their respective reference lines indicating negative bias
To Read Complete Report & Disclaimer Click Here
For More Axis Securities Disclaimer https://simplehai.axisdirect.in/disclaimer-home
SEBI Registration number is INZ000161633
Views express by all participants are for information & academic purpose only. Kindly read disclaimer before referring below views. Click Here For Disclaimer