Dollar gains on Recession Fears - HDFC Securities

Follow us Now on Telegram ! Get daily 10 - 12 important updates on Business, Finance and Investment. Join our Telegram Channel
Dollar gains on Recession Fears
* Risk is skewed toward a weaker rupee even after multiple measures from the central bank and government, as capital outflows along with weaker macro. In the week gone, the rupee depreciated 21 paise to 79.25 after marking a life low of 79.38. Technically, the rupee has been in a downtrend and a level below 79.40 could open for 80 and muchmore while gaining above 78.50 will negate the said view.
* India’s foreign exchange reserves fell to their lowest level in over 14 months as the central bank sold dollars to prop up the currency. The reserves fell $5.01 billion to $588.3 billion as of July 1, data published by the RBI shows.
* Weakness in the yen and euro has more to do with fundamentals than speculative bets and is likely to persist in years to come. On the Global FX front, the speculators bought dollars against every currency on our board as per the CFTC report. The aggregate dollar long rose by $2.1 billion, as none of the flow was huge in any individual currency. Among the more notable sales were euros (6.3k), and sterling (3.1k).
* Japan’s ruling coalition expanded its majority in an upper house election held Sunday, two days after the assassination of former Prime Minister Shinzo Abe. A clear mandate from the Japanese people will give improve Investors’ sentiment in Japan’s equity market opened higher on Monday.
* Asia’s week ahead contains a feast of data, interest-rate decisions, IIP, CPI and China’s GDP. People’s Bank of China to keep its one-year medium-term lending facility rate at 2.85% in its July operation. 2Q China’s GDP is likely to contract due to Shanghai’s lockdown, though June activity should show the economy starting to bounce. India’s CPI inflation likely inched higher in June, lifted by gains in food and core components driven by supply shocks and a lower year-earlier base.
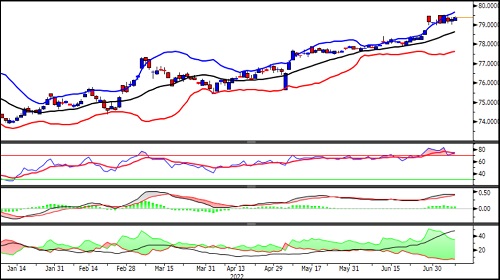
Technical Observations:
* USDINR July futures has been consolidating between 79 to 79.50.
* The short-term moving averages are placed above medium-term moving averages, indicating the continuation of its’ uptrend.
* Momentum oscillators, Relative Strength Index of 14 days oscillating near overbought zone and currently placed at 69.
* MACD is placed well above the zero line and heading north indicating a positive trend.
* The pair is having resistance at 79.90 and support at 79.
* The bias remains bullish as long as USDINR July futures trades above 78.80 while on the higher side 79.90 can be seen.
USDINR July Daily Chart
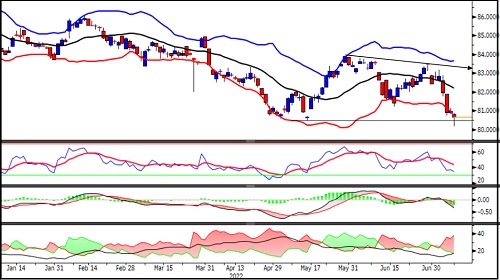
Technical Observations:
* EURINR July futures formed a hammer candlestick pattern on the daily chart below the Bollinger band, indicating a short-term reversal. However, traders need to wait for confirmation and that will come above 81.
* The pair manages to close above the August 2021 bottom after initially breaking that.
* Momentum oscillator, Relative Strength Index of 14 days heading towards oversold zone indicating bearish momentum.
* MACD has given a negative crossover and placed below the zero line indicating a weak trend.
* EURINR July futures is expected to trade lower and breaking 80 will accelerate selling while on the higher side 82.50 remains nearterm resistance.
EURINR July Daily Chart
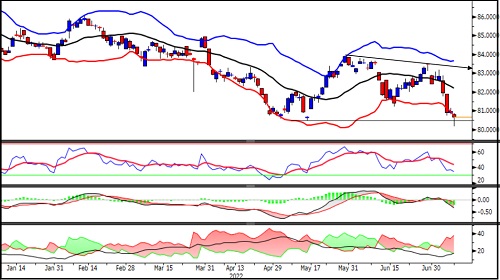
Technical Observations:
* GBPINR July futures closed below 20 days simplemoving average.
* The pair has formed a Doji Candlestick pattern indicating indecisiveness.
* It has been trading in a bearish sequence of lower top lower bottom on the daily chart.
* Directional Movement index showing weakness as -DI placed above +DI and ADX line up.
* Momentum oscillator, RSI has been placed sub 50 level indicating weak momentum.
* MACD is placed below zero line and weakening.
* GBPINR July futures is likely to remain under pressure as long as it crosses the level of 96 while on the downside it has support at 92
GBPINR July Daily Chart
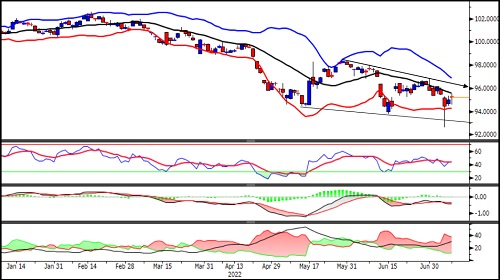
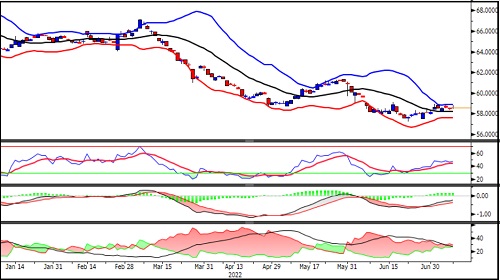
Technical Observations:
* JPYINR July futures started consolidating in a narrowrange of 58 to 58.60.
* The pair trading between the middle band and upper band of the Bollinger band and band has been narrow, an indication before sea-change.
* Momentum oscillator, Relative strength index of 14 days currently above 50 and strengthening.
* Directional movement index is indicating weakness in the trend as a gap between +DI and –DI has narrow and ADX line also heading south.
* The pair is having resistance at 58.60 and support at 58 breaking of either side will give a sharp and speedymove.
* The trend of JPYINR July future has weakened on daily chart and breaking of 58.60 will give short-covering bounce while breakingof 58 will drag it towards newlow.
JPYINR July Daily Chart
To Read Complete Report & Disclaimer Click Here
Please refer disclaimer at https://www.hdfcsec.com/article/disclaimer-1795
SEBI Registration number is INZ000171337
Views express by all participants are for information & academic purpose only. Kindly read disclaimer before referring below views. Click Here For Disclaimer


Top News
Range-bound markets waiting for news
Tag News

EURINR trading range for the day is 89.13 - 89.49. - Kedia Advisory


 320-x-100_uti_gold.jpg" alt="Advertisement">


