Palm oil prices on MCX look firm - Kedia Advisory

Follow us Now on Telegram ! Get daily 10 - 12 important updates on Business, Finance and Investment. Join our Telegram Channel
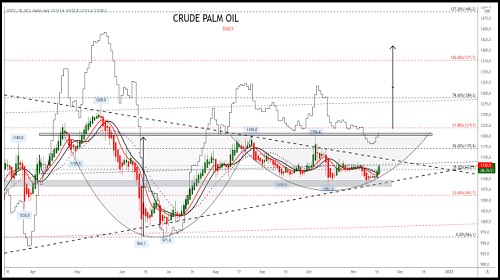
Crude Palm Oil
Palm oil prices on MCX look firm as since quite some time prices are holding very well above 1090 level for December contract we have seen prices are getting support tracking Malaysian palm oil futures which have extended their gains after the ringgit weakened, and as concerns over lower production and better-than-expected exports underpinned prices. Also, support was seen after the report from the Southern Peninsula Palm Oil Millers' Association (SPPOMA) who estimated a 6.3% drop on Nov. 1-15 production from the month before. Overall fundamentals are supportive and prices will remain elevated until improvement is sighted in output both in Malaysia and Indonesia. Exports of Malaysian palm oil products during Nov. 1-15 rose between 10% and 29% month-on-month, according to data released by cargo surveyors this week. As per the Daily chart, the technical indicator RSI turning Up towards the 60-level currently is at 54.68 which suggested an extended upside in Cpo prices for the coming session.
Technically prices are consolidating very well above the 1090 level while currently, prices are holding above 1120 level which is 38.20% of the Fibonacci level also on the daily chart a Cup & Handle pattern is forming a break and hold above 1200 level(Important multi-resistance level on MCX) can see good technical breakout which can see a sharp up move towards 1280 and a break above same can test 1360 level as if fundamentals and technical goes hand in hand.
If prices sustain above 1125 levels i.e above 50 DMA then chances to go towards its main resistance level of 1180 and which may be extended to 1200 levels also in the coming session. So we see traders can look to buy/accumulate the CPO on MCX in the range of 1100-1125 with stop loss below 1090 for immediate gains towards 1170 and 1200 level once prices close above the same then we can see price moving towards the said level of 1280 and above.
Technical Chart : MCX CPO
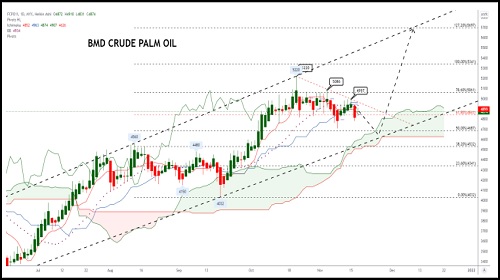
BMD Crude Palm Oil
While as per the above chart, one of the technical patterns looks extremely attractive for Cpo has been the ICHIMOKU pattern. As seen on the charts, the ‘Chikou Span’ (a line based on closing prices trailed backward) has shown signs of coming out of the cloud pattern on the Daily timeframe. The Kijun sen had acted as a strong support zone for the Cpo, this also indicates that the Cpo could continue to move up higher, and with this recent ICHIMOKU cloud breakout the pace of rally, as well as the participation levels, could increase in the Cpo. The importance of this pattern on the Daily chart is that in many cases we have witnessed commodities go into a strong bull run for coming days and not some short-lived trends. Even on the short-term chart, a price volume breakout of a multi week consolidation was considered extremely positive. Such breakouts have a tendency to change the range for the commodity even from a near-term view.
As per the Daily Technical indicator RSI turning upwards, it is at 51.37 which suggests extended upside in the BMD CPO prices for next few days, after crossing 52 it is expected to reach 60 RSI, which means fresh buying in BMD CPO can be witnessed.
Technical Chart : BMD CPO
To Read Complete Report & Disclaimer Click Here
Views express by all participants are for information & academic purpose only. Kindly read disclaimer before referring below views. Click Here For Disclaimer