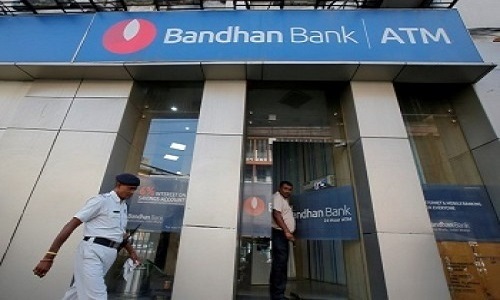
Buy Bandhan Bank Ltd For Target Rs.300 - ICICI Securities
Expect sharp rebound in profitability ahead
Bandhan Bank (Bandhan) reported Q4FY23 PAT of Rs8.08bn (vs Rs2.9bn QoQ), led by
a sharp rebound in NIMs and a sharp moderation in provisioning. Annualised RoA has
come in at 2.2%. While slippages were elevated, there is a healthy organic reduction in
stress pool. We highlight that including the expected CGFMU recovery of Rs17bn, (of
which Rs11bn is expected in Q1FY24 and Rs6bn in Q1FY25), the bank has ~100% PCR
on EEB reported stress pool (NPA+SMA1+2) and ~84% PCR on stress pool including
SMA 0.
With majority of stress recognition already done and collection efficiency rising to
>98%, we are modelling-in slippages at ~3.0% for FY24E/FY25E vs ~9.5-10% gross
slippages in the last two years. We appreciate the bank’s approach of creating
contingent provisions from the expected CGFMU recovery. Despite pressure on CoD
ahead, we model-in ~10 bps YoY uptick in calculated NIMs due to lower slippages.
Overall, we see the bank delivering ~20% loan growth, 2.3-2.4% RoA and ~19-20% RoE
for FY24E-FY25E. Risk returns are favourable with the stock trading at ~1.7/1.4x
FY24E/FY25E ABV and 9.5/7.6x FY24E/FY25E EPS, respectively. Tier 1 is adequate at
19.8% level. We maintain BUY with target price revised to Rs300 (earlier Rs350)
valuing the stock at ~1.8x FY25E ABV. Key risk is higher than expected stress
formation impacting profitability and growth.
* AUM growth picks up with revival in MFI; guidance at 20% YoY: Disbursements in
EEB segment picked-up sharply at 39% QoQ (though down 8% YoY), suggesting
healthy revival, also reflected in ~8% QoQ jump in AUM after three consecutive quarters
of QoQ decline. Disbursements in housing (down 57% QoQ) was impacted by IT system
migration (hence, flattish AUM QoQ) but seem to have normalised from March-April
onwards. Overall AUM grew 12% QoQ and ~10% YoY. The bank guides 20% YoY (vs
earlier 20-22% YoY) growth in AUM for FY24 led by housing (up 22-25%) and other
businesses, while EEB growth is guided at 17-18% YoY. We are modelling in AUM
growth, broadly in line with the management guidance.
* Deposits pick-up sharply; NIMs jump off low base: As against the last 4 quarters of
moderate-to-negative growth QoQ, savings balances jumped sharply at 11% QoQ (partly
seasonal) and was the key positive. The bank slowed down on term deposits (flattish
QoQ) and overall deposits growth was healthy at 6% QoQ (up 12% YoY). CASA share
has risen to 39% vs 36.4% QoQ and the bank guides CASA share at 40% for FY24. The
bank has seen a sharp rise in borrowings (up 34% QoQ) which has lower CoF, mainly
due to re-financing. Thus, better funding mix (higher CASA, re-financing and lower TD)
led to flattish cost of funds QoQ. Yields on advances jumped sharply on a) hike in
lending rates and b) lower interest reversals. Overall, NIMs jumped 80 bps QoQ to 7.3%.
Despite rising pressure on CoD ahead, we build ~10 bps uptick in calculated NIMs YoY
for FY24E as we estimate a sharp reduction in interest reversals on better asset quality.
* Slippages down but remain elevated; sharp decline in GNPA led by w-offs
while net NPA down to 1.17%: Overall slippages improved sharply QoQ to
Rs11.2bn though remain elevated at 4.3% annualised. EEB slippages reduced to
Rs7.48bn or 5.3% annualised vs 22% annualised QoQ. Due to hefty w-offs
(Rs23bn; predominantly EEB book), headline GNPA improved massively by 24%
QoQ; ratio down 228bps QoQ to 4.87%. PCR inched up QoQ to 76.82%. Net NPA
reduced to 1.17% from 1.86% QoQ.
* Adjusted PCR at ~100% for reported stress pool and 84% including SMA 0;
collection efficiency (ex-NPAs) at >98%. The bank is seeing a gradual
improvement in the SMA pool for EEB segment. O/s SMA (0+1+2) pool declined to
5.6% vs 8.1% QoQ, though is still higher than the pre-covid levels or business-as-
usual levels of 3-4% range. We calculate that adjusted for slippages / recoveries,
there has been around Rs5bn reduction in the SMA pool (vs Rs3bn QoQ and
around Rs29bn addition in Q2FY23) suggesting improving stress formation.
Including the expected CGFMU recovery of Rs17bn (of which, Rs11bn is expected
in Q1FY24 and Rs6bn in Q1FY25), the bank has ~100% PCR on EEB reported
stress pool (NPA+SMA1+2) and ~84% PCR on stress pool including SMA 0.
Excluding NPAs, collection efficiency has risen to 98.5% for the month of March
(98% for the month of Dec) as well as for Q4FY23 (96% QoQ).
* Outlook and view: Unlike peers, the bank has been more impacted by covid-19
due to geographical concentration and higher ticket size though now clearly stands
at almost the end of the covid-19 stress cycle. With majority of stress recognition
already done and collection efficiency rising to >98%, we are modelling-in
slippages at ~3.0% for FY24E/FY25E vs ~9.5-10% gross slippages in the last two
years. We also appreciate the bank’s approach of creating contingent provisions
from the expected CGFMU recovery. Despite pressure on CoD ahead, we model-
in ~10 bps YoY uptick in calculated NIMs due to lower slippages. Overall, we see
the bank delivering ~20% loan growth, 2.3-2.4% RoA and ~19-20% RoE for
FY24E-25E. Risk returns are favourable with the stock trading at 1.7/1.4x
FY24E/FY25E ABV and 9.5/7.6x FY24E/ FY25E EPS, respectively. Tier 1 is
adequate at 19.8% level. We maintain BUY with target price revised to Rs300
(earlier Rs350) valuing the stock at ~1.8x FY25E ABV. Key risk is higher than
expected stress formation impacting profitability and growth.
To Read Complete Report & Disclaimer Click Here
For More ICICI Securities Disclaimer https://www.icicisecurities.com/AboutUs.aspx?About=7 SEBI Registration number is INH000000412
Above views are of the author and not of the website kindly read disclaimer
