Banknifty opened sharply lower with a downward gap and selling pressure throughout the session - Axis Securities

Follow us Now on Telegram ! Get daily 10 - 12 important updates on Business, Finance and Investment. Join our Telegram Channel
Nifty
Nifty opened with a downward gap and remained sideways throughout the session. Nifty closed at 17223 with a loss of 23 points. On the daily chart the index has formed a small bullish candle with upper shadow indicating selling pressure as well as resistance at higher levels. The index continues to move in a Higher Top and Higher Bottom formation on the hourly chart indicating positive bias. The chart pattern suggests that if Nifty crosses and sustains above 17250 level it would witness buying which would lead the index towards 17350-17500 levels. However if index breaks below 17150 level it would witness selling which would take the index towards 17100-17000. Nifty is trading above its 20 day SMA which indicates positive bias in the short term. Nifty continues to remain in a downtrend in the short to medium term, so selling on rallies continues to be our preferred strategy.
The daily strength indicator RSI has turned positive from the oversold territory and is above its reference line indicating positive bias.
The trend deciding level for the day is 17200. If NIFTY trades above this level then we may witness a further rally up to 17315-17400-17515 levels. However, if NIFTY trades below 17200 levels then we may see some profit booking initiating in the market, which may correct up to 17110-17000-16910 levels.

Banknifty
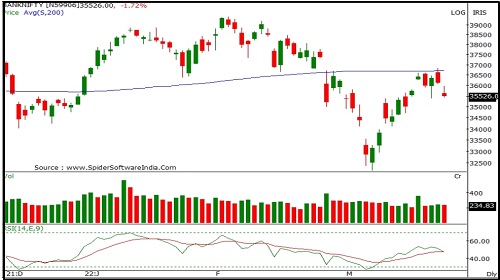
Banknifty opened sharply lower with a downward gap and selling pressure throughout the session dragged it lower to close on a negative note. Banknifty closed at 35527 with a loss of 620 points. On the daily chart the index has formed a bearish candle with a long upper shadow indicating selling pressure as well as resistance at higher levels. The index is moving in a Lower Top and Lower Bottom formation on the daily chart indicating negative bias. The chart pattern suggests that if Banknifty crosses and sustains above 35700 level it would witness buying which would lead the index towards 35800-36100 levels. However if the index breaks below 35400 level it would witness selling which would take the index towards 35000-34700. Banknifty is trading below 50 , 100 and 200 day SMA indicating negative bias in the short to medium term. Banknifty continues to remain in a downtrend in the short to medium term, so selling on rallies continues to be our preferred strategy.
The daily and weekly strength indicator RSI is moving downwards and is quoting below its reference line indicating negative bias. The trend deciding level for the day is 35635. If BANK NIFTY trades above this level then we may witness a further rally up to 35850-36170-36385 levels. However, if BANK NIFTY trades below 35635 levels then we may see some profit booking initiating in the market, which may correct up to 35315-35100-34775 levels.
To Read Complete Report & Disclaimer Click Here
For More Axis Securities Disclaimer https://simplehai.axisdirect.in/disclaimer-home
SEBI Registration number is INZ000161633
Views express by all participants are for information & academic purpose only. Kindly read disclaimer before referring below views. Click Here For Disclaimer