Banknifty opened on a flat note and remained in a small range throughout the day - Axis Securities

Follow us Now on Telegram ! Get daily 10 - 12 important updates on Business, Finance and Investment. Join our Telegram Channel
Nifty
Nifty opened on a flat note however profit booking for most part of the session led the index downwards to end in red. Nifty closed at 16125 with a loss of 90 points.
On the daily chart the index has formed a sizable bearish candle and has closed below previous session's low indicating negative bias. Since past 10-12 sessions, the index continues to consolidate in a broad trading range (16500-15700) representing a sideways trend. The chart pattern suggests that if Nifty crosses and sustains above 16200 level it would witness buying which would lead the index towards 16300-16400 levels. However if the index breaks below 16100 level it would witness selling which would take the index towards 16000-15800. Nifty is trading below its 20, 50, 100, and 200-day SMA which indicates negative bias in the short to medium term. Nifty continues to remain in a downtrend in the short to medium term, so selling on rallies continues to be our preferred strategy.
The daily strength indicator RSI has turned positive from the oversold territory and is above its reference line indicating positive bias.
The trend deciding level for the day is 16155. If NIFTY trades above this level then we may witness a further rally up to 16230-16340-16415 levels. However, if NIFTY trades below 16155 levels then we may see some profit booking initiating in the market, which may correct up to 16050-15970-15865 levels.

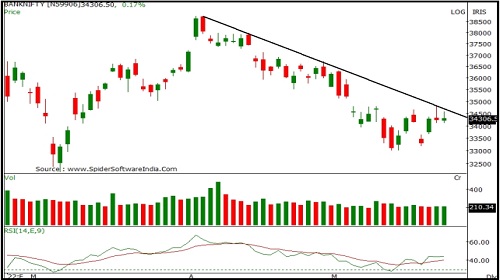
Bank Nifty
Banknifty opened on a flat note and remained in a small range throughout the day. Banknifty closed at 34290 with a gain of 43 points.
On the daily chart the index has formed a small Bullish candle with upper shadow indicating selling pressure as well as resistance at higher levels. Since the past couple of weeks, the index continues to consolidate in a broad trading range (34800- 33000) representing a sideways trend. The chart pattern suggests that if Banknifty crosses and sustains above 34500 level it would witness buying which would lead the index towards 34800-35000 levels. However if the index breaks below 34200 level it would witness selling which would take the index towards 34000- 33800. Banknifty is trading below 20, 50, 100 and 200 day SMA indicating negative bias in the short to medium term. Banknifty continues to remain in a downtrend in the short to medium term, so selling on rallies continues to be our preferred strategy.
The daily strength indicator RSI has turned positive from oversold and is above its reference line indicating sustained strength.
The trend deciding level for the day is 34330. If BANK NIFTY trades above this level then we may witness a further rally up to 34545-34800-35015 levels. However, if BANK NIFTY trades below 34330 levels then we may see some profit booking initiating in the market, which may correct up to 34075-33860-33605 levels.
To Read Complete Report & Disclaimer Click Here
For More Axis Securities Disclaimer https://simplehai.axisdirect.in/disclaimer-home
SEBI Registration number is INZ000161633
Views express by all participants are for information & academic purpose only. Kindly read disclaimer before referring below views. Click Here For Disclaimer


More News

The Nifty commenced trade with loss led by weak global cues, only to recover entire 100 poin...