The Nifty witnessed decent recovery from intraday lows of 17254 driven by outperformance of banking stocks and managed to settle almost flat - ICICI Direct

Follow us Now on Telegram ! Get daily 10 - 12 important updates on Business, Finance and Investment. Join our Telegram Channel
https://t.me/InvestmentGuruIndiacom
Download Telegram App before Joining the Channel
NSE (Nifty): 17353
Technical Outlook
* The Nifty witnessed decent recovery from intraday lows of 17254 driven by outperformance of banking stocks and managed to settle almost flat. As a result price action formed a Hanging Man like candle with lower high-low that indicates a slowdown in momentum after a sharp 12% rally in just five weeks, that led daily and weekly stochastics in overbought trajectory (readings beyond 90) Elevated volatility over past couple of sessions is thus on expected lines
* We expect the index to undergo a healthy consolidation amid stock specific action while sectoral rotation would continue, which is a sign of healthy structural uptrend. Our broader positive stance is intact with Nifty gradually heading to 17600 in September 2021 as it is the price parity of July-August rally (15515-16700), projected from mid-August low of 16376. Hence, we recommend sticking to a buy ondecline strategy in to accumulate quality stocks as over past 15 months such strategy has worked well
* Broader market indices are expected to continue their resilience and head higher after couple of days breather. We expect Nifty small cap index to catch up after strong base formation at 50 DEMA, as it is just 1% away from lifetime highs
* Structurally, as per classic Dow Theory, the formation of higher high and low, signifies continuance of positive bias which makes us confident to revise support base upward at 16900, as it is 50% retracement of current up move (16376 - 17340)
In the coming session, index is likely to open on a soft note amid weak Asian cues. We expect the index to consolidate in a range post its recent gains. In the last two sessions the index is seen facing hurdle around 17400 levels, hence use pullback towards 17390-17415 for creating short position fortargetof 17305.
NSE Nifty Weekly Candlestick Chart

Nifty Bank: 36768
Technical Outlook
* The daily price action formed a bull candle with a higher high - low as buying demand emerged from near the recent four months range breakout area (36300 ) . The index in the process on expected lines maintained the rhythm of not correcting more than three -four consecutive sessions as seen since April 2021 highlighting strength
* Going ahead, we expect the index to maintain positive bias and gradually head towards 37700 levels in the coming weeks as it is the confluence of the measuring implication of the recent range breakout (36300 -34800 ) and the previous all -time high of February 2021
* Buying on declines strategy has worked well over past 15 months . In the current scenario also buying demand emerged after three sessions of breather signaling resilience
* The index is seen forming higher high -low in the larger degree chart, which gives up confident to revise the support base higher towards | 35300 -35500 levels as it is the confluence of the following technical observations
* 80 % retracement of the current up move (34817 -37140 ) placed around 35300 levels
* rising 50 days EMA also placed around 35570 levels
* the value of the rising trend line joining the previous lows is also placed around 35400 levels
* The daily stochastic has cooled off from the overbought territory and is seen forming a base near the neutral reading of 50 thus supports the positive bias in the index .
* In the coming session, index is likely to open on a soft note amid weak Asian cues . We expect the index to trade in a range with positive bias while holding above Wednesday’s low (36393 ) . Hence, use intraday dips towards 36550 -36610 for creating long position for target of 36840 , maintain a stoploss of 36430.
Nifty Bank Index – Daily Candlestick Chart

To Read Complete Report & Disclaimer Click Here
https://secure.icicidirect.com/Content/StaticData/Disclaimer.html
Views express by all participants are for information & academic purpose only. Kindly read disclaimer before referring below views. Click Here For Disclaimer


Top News
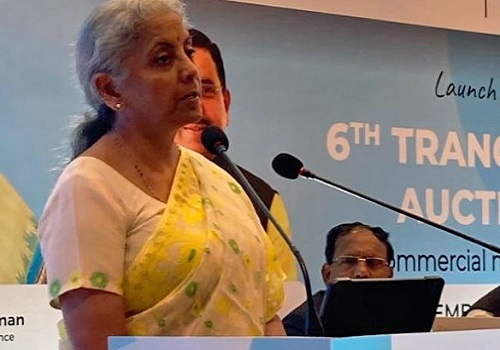
Greater investment needed in coal production projects : Finance Minister Nirmala Sitharaman

Tag News

Stock Picks : TCS Ltd And Chambal Fertiliser Ltd By ICICI Direct