Rupee falls to five month low after RBI surprised market with GSAP-1 - HDFC Securities

Rupee falls to five month low after RBI surprised market with GSAP-1 - HDFC Securities
Rupee depreciated for the second week in row, marked biggest weekly decline after March 2020 as market participants remained concerned about a new wave of coronavirus infections and localized lockdowns may hamper business recovery. The currency has seen a rapid slide against dollar over the past few days amid a sharp unwinding of carry positions, built around $50b. Also, the drum beat of inflation fears will ramp up in coming month after RBI’s formal adoption of quantitative easing last week where they committed to buy 1t rupees of bonds this quarter. This seems an immediate trigger in rupee sell-off.
Spot USDINR jumped 2.23% to 74.75 a dollar in the week gone. The pair is expected to consolidate in the range of 75.15 to 74.30 in holiday truncated week. The forex market will remain close on Tuesday and Wednesday on Account of Gudi Padwa and Dr. Ambedkar Jayanti respectively. The focus will remain on spread of virus and economic data which will decide the trend of currency.
The worries over second and third virus waves are hitting countries from France to Brazil and India hard, with lockdowns and curfews cramping citizens and economies desperate to reemerge from Covid-19 restrictions.
US Dollar has undergone considerable selling pressure over the last few trading sessions along with Treasury yields. US Dollar gave away about one-third of gains recorded by the DXY Index during the first quarter. This was followed by unwavering dovish guidance conveyed in recent Fed speeches.
CFTC Data: The flows were skewed toward more dollar buying, with sales notable in the euro (6.2k), sterling (5k), AUD (8.2k) and CAD (6.5k). There was small buying of 1.5k yen. The aggregate dollar short fell by another $2 billion during the week, and now stands at a fairly modest $4 billion.
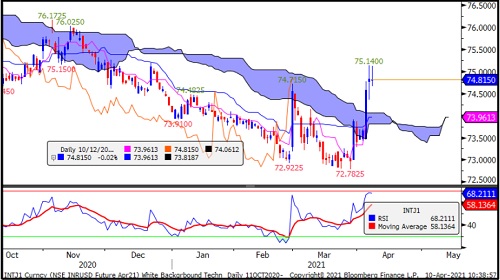
USDINR
USDINR April futures formed Doji candlestick on daily chart suggesting indecisiveness at current level after sharp rally in last couple of days.
The pair has support of Leading span A support at 73.96 and resistance at 75.15 and 76 odd level.
Momentum oscillator, Relative Strength Index(RSI) of 14 days period about to enter in overbought zone suggesting continuation of upward momentum.
USDINR April futures expected to trade with positive bias following higher high and higher low formation on daily chart.
The pair expected to retrace in coming days ahead of the heading higher. It is expected to trade in the range of 74.50 to 75.30 range next week.
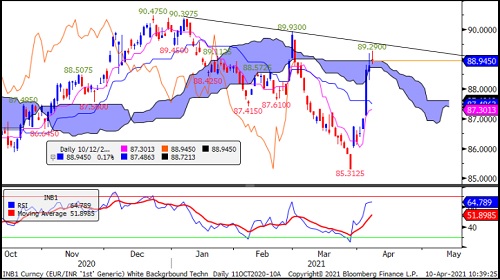
EURINR
EURINR April futures closed at Leading span B level and formed doji candlestick pattern suggesting indecisiveness.
The pair has downward slopping trend line resistance around 89.50 (as shown in chart)
Momentum oscillator, Relative Strength Index on daily chart headed higher with positive cross over indicating strength in the pair.
Looking at the overall chart pattern of EURINR and EURUSD, it has been in the down trend.
The trend reversal level for EURINR April futures is above 89.50 while on downside we see support at 88.42 and 87.42.
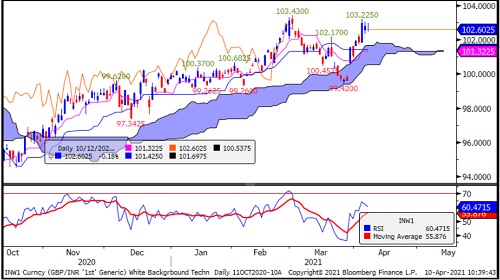
GBPINR
GBPINR April futures traded higher after taking support at Leading Span B at 99.42. The formation of higher highs and lows on weekly chart suggesting continuation of bullish trend.
The pair is having support at 101.42 and resistance at 103.43.
Momentum oscillator, Relative Strength Index (RSI) on daily chart has been holding well above 50 level indicating continuation of positive momentum.
We expect consolidation in GBPINR April futures coming week.
The trend reversal can be seen only below 99.26 while on higher side crossing of 103.43 level confirms new territory for the pair.
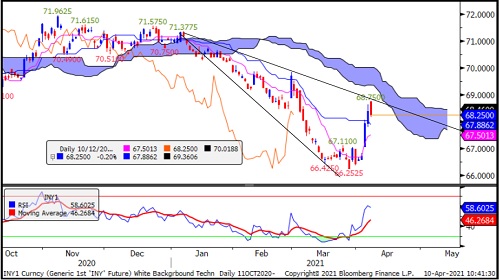
JPYINR
JPYINR April futures marked “V” shaped recovery in last week. However, the trend remains bearish as it has been trading below Ichimoku cloud.
The pair is having falling trend line and Ichimoku Leading span 2 resistance around 69 odd levels.
The pair has 55 EMA resistance at 68.80.
The pair is having support at 67.60, the 23.6% Fibonacci retracement adjoining high of 71.96 and 66.25.
Momentum oscillator, RSI on daily chart headed higher and placed well above 50 level but for the trend reversal it requires to trade above 69 odd level.
Looking at the overall chart pattern and technical evidences, we remain bearish in JPYINR April futures
To Read Complete Report & Disclaimer Click Here
Please refer disclaimer at https://www.hdfcsec.com/article/disclaimer-1795
SEBI Registration number is INZ000171337
Views express by all participants are for information & academic purpose only. Kindly read disclaimer before referring below views. Click Here For Disclaimer


.jpg)