Weekly Tech Picks - MOIL Limited, CESC Limited, Bharti Airtel Limited, Indo Count Industries Limited By Axis Securities

MOIL Limited
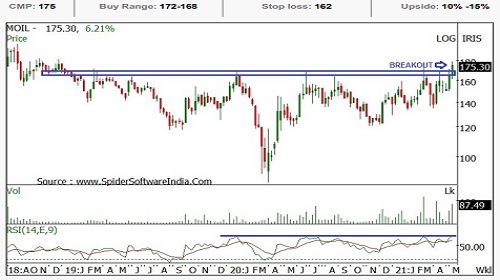
Buy Range 172-168 CMP 175 SL 162 Upside 10% -15%
* On the weekly chart, the stock has witnessed three years “Multiple Resistance Zone” breakout around 170 levels on a weekly closing basis which signals strong comeback of bulls
* Huge volumes on the weekly chart, signals increased participation near breakout zone MOIL Limited Weekly Tech Picks 07 May 2021
* On the weekly time frame, the stock has witnessed “Bollinger Band” breakout which signals increased volatility
* Currently stock is well placed above its 20, 50, 100 and 200-day SMA which reconfirm our bullish thesis
* The weekly strength indicator RSI is placed above 50 mark which supports rising strength. The above analysis indicate an upside of 187-195 levels. *Holding period is 3 to 4 weeks.
CESC Limited
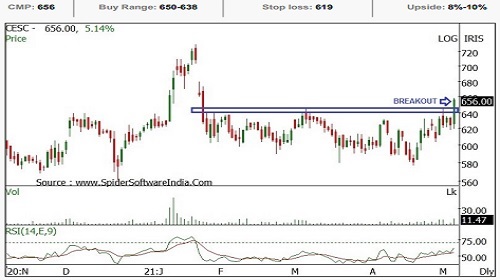
Buy Range : 650-638 CMP 656 SL 619 Upside 8%-10%
* On the daily chart, the stock has witnessed three months “Multiple Resistance ” breakout at 642 levels
* Huge volumes spurt on breakout confirm increased participation on rally
* Stock has also bounced back from its 20 and 50 day SMA (612) which remains a crucial support zone
* On the daily time frame, the stock has witnessed “Bollinger Band” breakout which signals increased volatility
* The Daily, weekly and monthly strength indicator RSI is in bullish mode which supports rising strength as well as momentum.
* The above analysis indicate an upside of 694-710 levels
Bharti Airtel Limited
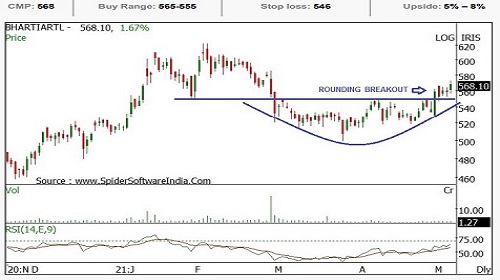
Buy Range : 565-555 CMP 568 SL 546 Upside 5% – 8%
* The stock has decisively broken out its two months “Rounding Bottom” formation breakout at 552 levels on closing basis indicating strong come back of bulls
* This buying momentum was observed from its weekly 50% Fibonacci Retracement support of 508 levels
* The stock is well placed above its 20, 50 , 100 and 200 day SMA which supports bullish sentiments ahead
* The daily and weekly strength indicator RSI is in bullish mode along with positive crossover which supports rising strength
* The above analysis indicate an upside of 588-605 levels
* Holding period is 3 to 4 weeks.
Indo Count Industries Limited
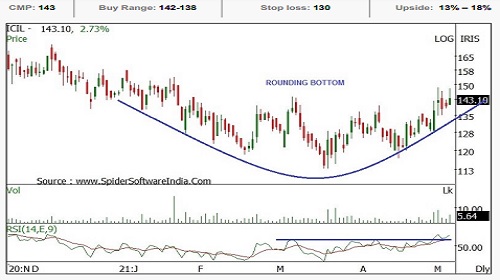
Buy Range : 142-138 CMP 143 SL 130 Upside 13% – 18%
* On the daily chart, the stock has witnessed breakout from its four months “Rounding Bottom” breakout around 139 levels on a closing basis which signals positive bias
* This buying momentum was observed from its 20 and 50 day SMA (128) which supports bullish sentiments on medium term time frame
* On the weekly chart, the stock has also broken out its past 6 months DownSloping Trend line at 138 levels with huge volumes
* The daily and weekly strength indicator RSI is in bullish mode which supports rising strength
* The above analysis indicate an upside of 158-165 levels
* Holding period is 3 to 4 weeks
To Read Complete Report & Disclaimer Click Here
For More Axis Securities Disclaimer https://simplehai.axisdirect.in/disclaimer-home
SEBI Registration number is INZ000161633
Above views are of the author and not of the website kindly read disclaimer


.jpg)