Weekly Tech Picks -Sumitomo Chemical India Ltd, Cipla Ltd, Bharat Dynamics Ltd,Voltas Limited(Future) By Axis Securities

Sumitomo Chemical India Limited
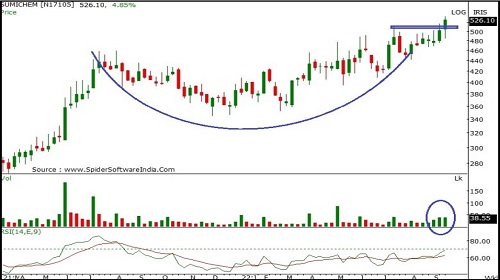
• On the daily time frame, the stock has observed “cup & handle” breakout around 518 levels along with huge volumes
• The stock is well placed above its 20,50,100 and 200 Day SMA’s which reconfirm bullish sentiments
• The daily “band Bollinger” buy signal 16 September,2022indicate increased momentum
• The daily and weekly strength indicator RSI is in positive terrain and sustaining above 9EMA mark indicating positive momentum.
• The above analysis indicate upside of 565-590 levels. *Holding period is 3 to 4 weeks
Buy Sumitomo Chemical India Limited CMP: 526 Buy Range: 520-510 Stop loss: 490 Upside: 10% - 15%
Cipla Limited
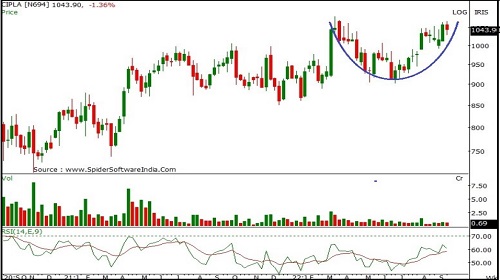
• On the weekly time frame the stock has decisively broken out above “rounded bottom” pattern.
• The stock is well placed above 20, 50, 100 and 200 day SMA’s which reconfirms bullish trend
• On the daily and the weekly time frame, the stock is in strong up trend forming Cipla Limited Weekly Tech Picks 16 September,2022a series of higher tops and bottoms
• The daily and weekly strength indicator RSI is in bullish mode and sustaining above 50 mark indicating sustained strength
• The above analysis indicate an upside of 1100-1145 levels.
• Holding period is 3 to 4 weeks.
Buy Cipla Limited CMP: 1044 Buy Range: 1040-1020 Stop loss: 995 Upside: 7% - 11%
Bharat Dynamics Limited
• On the weekly chart, the stock has confirmed “Ascending triangular” pattern breakout around 907 levels on a closing basis. Rising volumes at breakout zone indicates increased participation.
• The stock is well placed above its 20, 50 and 100 day SMA’s and sustaining above the same which reconfirm bullish 16 September,2022above the same which reconfirm bullish sentiments
• The daily as well as “band Bollinger” buy signals indicate increased momentum
• The daily and weekly strength indicator RSI is above its reference line indicating positive bias.
• The above analysis indicate upside of 1055-1085 levels.
Buy Bharat Dynamics Limited CMP: 929 Buy Range: 925-907 Stop loss: 845 Upside: 15% - 18%

Voltas Limited(Future)
• On the weekly chart, the stock has confirmed “Head & Shoulder“ breakdown at 932 levels indicating downside trend reversal.
• This breakdown is accompanied with rising volume indicating increased in selling pressure at breakdown zone
• The is trading below 20,50, 100 and 200 SMA indicating negative trend and 16 September,2022200 SMA indicating negative trend and bearish sentiment on a stock.
• The daily and weekly strength indicator RSI is in bearish mode and pointing south.
• The above analysis indicate downside of 835-805 levels.
• Holding period is 3 to 4 weeks.
Buy Voltas Limited(Future) CMP: 913.80 Sell Range: 915-933 Stop loss: 970 Upside: 10% - 13%

To Read Complete Report & Disclaimer Click Here
For More Axis Securities Disclaimer https://simplehai.axisdirect.in/disclaimer-home
SEBI Registration number is INZ000161633
Above views are of the author and not of the website kindly read disclaimer