Weekly Market Commentary Real Yields Set the Pace by Binance Research

Key Summary
Yields are rising on real rates, not inflation. Since August 31 the 10-year U.S. Treasury yield is up 47bp, of which 43bp is the real yield, now 2.87% after reaching 2.95% on October 5, the highest since 2008; breakevens are up 4bp. Since the hike the move has been in the long end.
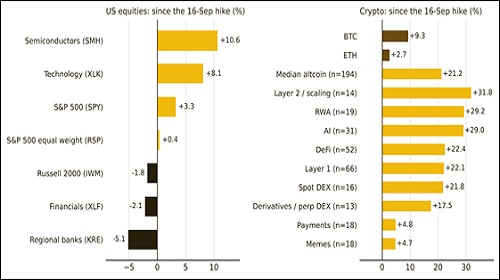
Record highs on a narrow base. Since the hike, S&P 500 is up 3.3% and semiconductors 10.6%, while small caps and banks are lower and the equal-weight index is flat.
Crypto leadership is narrow too. Since the hike, Bitcoin is up 9.3% and Ether 2.7%; Layer 2, real-world-asset and AI tokens lead, while memes and payments have lagged.
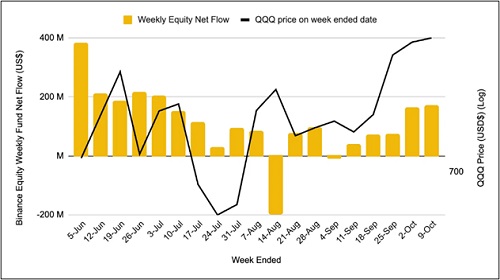
Semiconductor attracted inflows despite a sector-wide decline. . Equity inflows on Binance totaled US$169M; with semiconductor inflows nearly quadrupling to US$73M, led by Intel, even as the sector fell 5% over the week.
Market View: Record High, Rotating Leadership
The S&P 500 regained its all-time high on Tuesday (7,819) and is up 1.2% on the week, but leadership rotated: the equal-weight index rose 1.6%, with utilities (+4.0%), energy (+3.6%) and consumer staples (+3.6%) ahead, while semiconductors fell 5.0% and the Nasdaq-100 was flat (+0.2%), narrowing a gap that had widened since the September hike. The 10-year yield closed at 5.31% on Monday, its highest of the week, and eased to 5.24%. The September FOMC minutes showed all participants backed the hike and most expect another by year-end; October hike odds stayed near 20%. Crypto lagged: Bitcoin is down 3.3% to US$83,700, Ether 7.0% and the altcoin index 3.6%. The dollar index rose 0.3%, gold 1.3% and Brent, above US$100 on a weekly basis since September, traded near US$105.
Figure 1: Weekly and year-to-date performance: crypto and global market assets

Market Alpha: Real Rates and Dispersion
Yields and equities have risen together as real rates are driving the move.
Since August 31, the 10-year yield has risen 47bp to 5.22%. Of that increase, only 4bp has come from higher breakeven inflation, while; 43bp has come from higher real yields, which now stands at 2.87% after reaching 2.95% on October 5, their highest since November 2008.
The curve dates two drivers. Ahead of the September 16 hike, the 2-year U.S. Treasury yield led (+40bp against +10bp for the 30-year),marking a repricing of the policy path. Since the hike the 2-year yield is up 1bp and the 30-year 25bp, a term-premium move consistent with the weaker 30-year auction on October 8 (indirect bidders 72% against 80% in September).
This composition explains why higher yields have not, by themselves, weighed on equities. Higher real yields with stable break evens compress valuations but do not signal an inflation shock. What offset the compression is earnings. Consensus 12-month forward EPS for the S&P 500 is 37% higher than a year ago while the index is up 16%, so the forward P/E has fallen from 22.9x to 19.4x even as the index made a new high on October 6.
History offers some context. Since 1990, there have been eleven episodes in which the 10-year yield rose by at least 50bp within 40 trading days while the S&P 500 sat within 1% of a record high. In all eleven cases, the index was higher three months later, with a median gain of 2.8%.Six months later, it was higher in eight of the eleven episodes, with a median gain of 5.2%; the exceptions were 1993, 2007 and 202).
These historical comparisons are useful context, but not a signal. The coming week will test each component of the current setup: CPI will shape breakeven inflation expectations, bank guidance will provide a read on growth, and Friday's TIC data will offer insight into long-end demand behind the term premium.
Figure 2: The rise in the 10-year U.S. Treasury yield since August has come from real yield, not inflation expectations; since the hike it has been driven by the long end
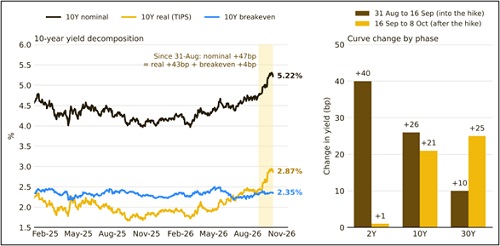
Nominal, real and breakeven 10-year yields
Winners and losers: leadership is narrow in both markets
Since the hike, the S&P 500 is up 3.3%, but the Russell 2000 and financials are lower and the equal-weight index is flat; semiconductors (+10.6%) have carried the index. Banks are the weakest group, and the de-rating has come through valuation rather than earnings: 30-day Q3 EPS revisions are flat for the deposit-heavy banks and negative only where market revenue is the driver. The market is pricing the rate environment ahead of the numbers; guidance on October 13–14 will be the first test.
Crypto over the same window is broader but just as uneven. Bitcoin is up 9.3% and Ether 2.7%, while the median of 194 other coins is up 21%. The gains sit in Layer 2 (+32%), real-world assets (+29%) and AI (+29%); memes (+5%), and payments (+5%). In both markets, a narrow set of growth or narrative leaders has outperformed, while the rest of the beta has lagged behind while real yields rose.
The takeaway is that higher real yields are restrictive, but the pressure so far has fallen on broad beta and the rate-sensitive parts of each market rather than on the leaders, which makes the next two weeks a test for those leaders. In equities, Q3 earnings will determine whether growth can continue to offset a 2.9% real yield; a miss or cautious guidance could broaden weakness into today's winners. In crypto, Bitcoin has held its post-hike gain, but a further rise in the long end would test that resilience without any earnings offset. Real yields and earnings guidance are the two signals to watch.
Figure 3: Winners and losers since the September 16 hike: US equity segments and crypto categories (median)
Equity Fund Flow on Binance
Net inflows into equities on Binance rose to US$169M in the week of October 5 to 9, from US$163M a week earlier, the largest weekly total since early July, as QQQ edged up 0.2%. Technology (US$79M), Financial Services (US$32M) and Healthcare (US$26M) made up 81% of the total.
Semiconductors were the standout. Inflows nearly quadrupled to US$73M, 43% of the week’s total, in a week the semiconductor ETF (SOXX) fell 5.0%. Intel drew US$32M, the largest single-name inflow, while the stock fell 12%. Nvidia added US$10M and the memory complex drew US$20M across SK Hynix (US$7.5M, reversing a US$2.4M outflow), SanDisk (US$7.2M) and Micron (US$5.3M). Leveraged ETFs as a group swung from a US$3M outflow to a US$17M inflow, led by TQQQ (US$9.1M), the 3x Korea ETF KORU (US$4.6M) and SOXL (US$2.9M). Inflows into a declining sector, partly through leveraged products, are more consistent with dip-buying than momentum.
Healthcare inflows quadrupled on Moderna (US$15M, up 60% over the past month) and Pfizer (US$8.4M), while Industrials more than doubled to US$16M, led by Rocket Lab (US$8.1M). Crypto proxies faded with Bitcoin: Circle fell to US$15M from US$36M and Capital Markets nearly halved to US$27M. SpaceX saw the largest outflow (US$8.8M) after two weeks of buying, Tesla flipped from a US$5.3M inflow to a US$7.2M outflow, Corning shed US$5.4M and Synopsys gave back US$2.2M after last week’s US$35M inflow.
Figure 4: Weekly equity fund flow on Binance, Monday to Friday
Looking Ahead
Two things will decide the week: the September CPI on Wednesday and the first full quarter of bank earnings since the hike. Consensus expects headline CPI rising to 3.7% from 3.4%; a print above that would revive the odds of an October hike odds, now near 20%, while a softer one would leave the 10-year yield, rather than the Fed, as the variable for risk assets. From Saturday, the Fed enters its pre-meeting blackout, making the 20-year auction on October 21 the next read on long-end demand. For Bitcoin, the question is whether ETF inflows can hold through a CPI-day move in yields.












More News

Key Highlights: Stocks in News, Economic & Global Updates 14th October 2026 by GEPL Capital Ltd