USDINR Report As On 25th May 2026 By Amit Gupta- Kedia Advisory
USDINR
Volatility
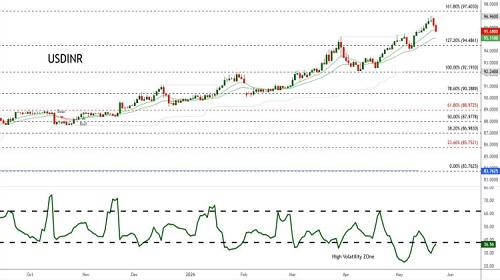
USDINR continues to trade within a strong bullish structure, supported by sustained directional momentum and higher price formation. The Choppiness Index is gradually moving lower, indicating the market is transitioning away from a volatile sideways phase into a more trending environment. This reflects improving trend strength and suggests bullish momentum remains structurally intact, although intermittent consolidation phases may continue during the broader upward move.
MACD
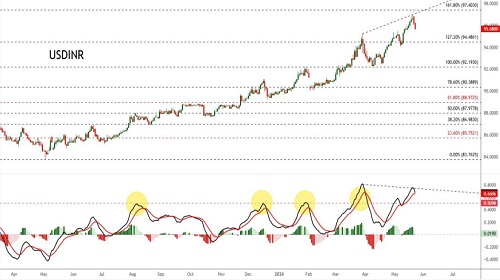
USDINR continues to trade in a strong bullish trend, supported by sustained higher highs and positive momentum structure. The MACD indicator remains in bullish territory with the signal line holding above the zero axis, confirming underlying trend strength. However, the indicator is showing signs of momentum slowdown and mild bearish divergence, suggesting the ongoing rally may enter a temporary consolidation phase before the broader uptrend potentially resumes.
FISHER
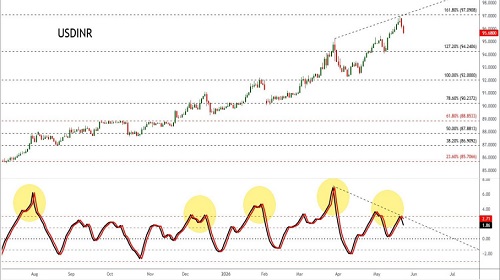
USDINR continues to maintain a structurally bullish trend, reflecting sustained currency weakness and strong upside momentum. However, the Fisher Transform indicator is currently showing bearish divergence along with overbought exhaustion signals, indicating weakening momentum and the possibility of short-term consolidation before the broader uptrend potentially resumes.
VORTEX
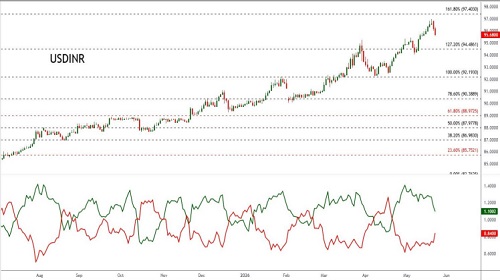
USDINR continues to maintain a strong bullish price structure, reflecting sustained upward momentum and trend continuation. The Vortex Indicator shows the positive trend line remaining above the negative trend line, confirming prevailing bullish strength in the currency pair. However, the narrowing spread between both lines suggests momentum is gradually cooling, indicating the possibility of temporary consolidation while the broader bullish trend remains structurally intact.
ULCER
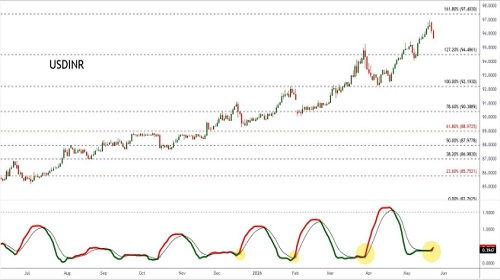
USDINR continues to trade within a broader bullish structure; however, the Ulcer Index is now signaling early signs of trend exhaustion after remaining at extremely strong levels for an extended period. Historically, similar bearish crossovers and rising stress signals in the indicator have preceded corrective pullbacks, as witnessed during December 2025, January 2026, and late March 2026 phases. The current setup indicates weakening momentum and suggests the ongoing rally may enter a short-term pullback or consolidation phase before the broader trend direction becomes clearer.
OUTLOOK
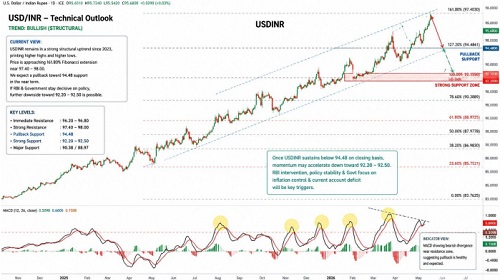
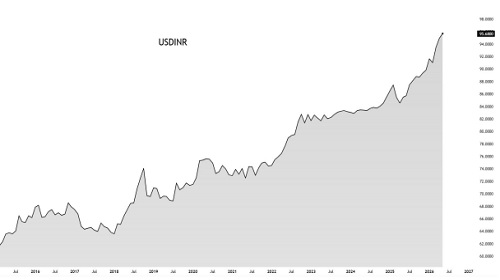
The Indian Rupee has entered one of its most volatile macroeconomic phases in recent history, with USDINR recently touching an all-time high near 95.96, making the rupee one of Asia’s weakest-performing currencies in 2026. The sharp depreciation has been driven by a powerful combination of surging crude oil prices, widening external deficits, aggressive dollar demand, and slowing foreign capital inflows. However, while the broader long-term structure of USDINR remains bullish, technical indicators now suggest that the pair may witness a meaningful corrective pullback toward key support zones before attempting another upward move.
The biggest pressure point for the Indian economy remains crude oil. India imports nearly 85–89% of its crude requirements, making the rupee extremely sensitive to energy shocks. Brent crude has surged above the psychologically critical $100-per-barrel mark for the first time since the 2022 energy crisis, largely due to escalating geopolitical tensions in West Asia and supply disruptions around the Strait of Hormuz. Economists estimate that every $1 rise in crude oil prices increases India’s annual import bill by nearly $1.5–2 billion, significantly widening the Current Account Deficit (CAD)
India’s merchandise trade deficit has simultaneously expanded to a record $333 billion in FY26, with total imports rising toward $775 billion while exports remained relatively stagnant near $442 billion. Elevated imports of crude oil, gold, electronics, edible oils, and industrial components have placed enormous pressure on the country’s dollar reserves and external balance sheet. On the capital account side, foreign inflows have also weakened considerably. Global investors have increasingly shifted toward AI-led technology economies and export-manufacturing hubs such as Taiwan, Vietnam, and Malaysia under the “China Plus One” strategy. As a result, India’s Balance of Payments position has deteriorated sharply, with several economists projecting the overall BOP deficit near $65 billion during the current cycle.
RBI data already showed a balance of payments deficit of $10.9 billion in Q2 FY26, while the broader deficit trend has remained under pressure due to slowing portfolio flows and external uncertainty. To stabilize the currency, the Reserve Bank of India has actively intervened in the forex market, reportedly selling between $800 million and $2 billion daily during periods of extreme volatility.
Despite these interventions, the rupee has continued making record lows as global dollar strength, rising US bond yields, and oil-import demand outweighed central bank defense measures. India’s forex reserves currently stand near $697 billion, still sufficient to cover over 10–11 months of imports, giving RBI a strong macro buffer despite ongoing intervention pressure. From a technical perspective, USDINR remains in a strong structural uptrend after rallying nearly 10% over the last year.
However, the pair recently tested the major 161.8% Fibonacci extension zone near 97.40, where momentum indicators such as MACD are showing bearish divergence — a classic sign that upside momentum is gradually weakening. This increases the probability of a healthy corrective decline in the near term. The immediate support level for traders now stands at 94.48, which coincides with the 127.2% Fibonacci support zone and previous breakout region.
A pullback toward this level would still keep the broader bullish structure intact. However, if RBI intervention intensifies and the government aggressively focuses on inflation control, import management, and liquidity tightening, the correction may extend toward the strong support band of 92.20-92.50 zone. For now, the long-term trend remains bullish for USDINR, but technically the market appears overextended. Traders should remain alert for a short-term pullback phase, especially as profit booking emerges near historic resistance zones and macro volatility continues dominating currency markets.
Above views are of the author and not of the website kindly read disclaimer