

The Indian equity benchmark started the truncated week on a positive note and settled the at 24,585, up 0.91% - ICICI Direct

Nifty :24585
Technical Outlook
Day that was…
* The Indian equity benchmark started the truncated week on a positive note and settled the at 24,585, up 0.91%. Mirroring the benchmark the Nifty Midcap and Small cap indices concluded with a gain up 0.85% and 0.36% respectively. Sectorally, barring Consumer durables all indices closed in green, where, PSU Bank, Realty and Healthcare outperformed.
Technical Outlook:
* Nifty defended previous two sessions identical lows and witnessed supportive efforts in the vicinity of 12th May 2025 gap zone which helped it to erase all the previous sessions losses as a result it made a strong bull candle indicating buying demand at gap zone.
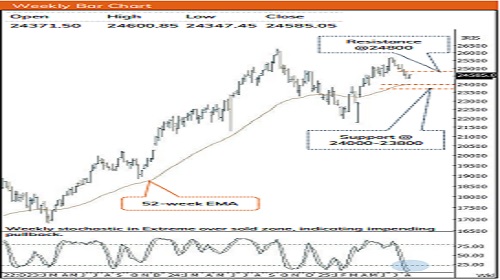
* Key point to highlight is that, index staged a strong recovery from over sold conditions as weekly stochastics has witnessed the lowest reading of 2.7 since 1995 last week, indicating technical pullback. Going ahead, to pause the ongoing downward momentum index need a follow through strength and a decisive close above previous session’s high for a meaningful pullback to materialize. Further, any positive development on tariff front would help index to resolve higher and witness technical pullback towards 24800 marks in the coming weeks. Failure to do so would result into extended correction wherein key support is placed around 24000-23800 levels. Going forward, the tariff related development would dictate the further course of action.
* On the structural front, market breadth has bounced from the bullish support zone of 25 where the % of stocks above 50 days EMA currently is at 29 that offers incremental buying opportunity. We believe, the earning-based volatility is likely to subside as we enter the fag end of the earning season while focus will now completely shift to tariff development.
* In the technical parlance, 52 weeks EMA (Equivalent to 200 days) has the utmost importance where long term accumulation take place. The index is approaching key support zone of 24000-23800 being 52 weeks EMA and 50% retracement of entire up move off April low 21743 amid oversold condition, indicating possibility of technical pullback cannot be ruled out. Hence, traders should refrain from creating aggressive short position in the truncated week. Instead focus should be on accumulating quality stocks backed by strong earnings in a staggered manner.
* On the sectoral front, focus should be on domestic themes thereby BFSI, Consumption, Capital Goods & infra would be in focus.
Key monitorable to watch out for in current volatile scenario:
a) Development of Bilateral trade deal negotiations.
b) US and Domestic inflation print
c) U.S. Dollar index retreated from past two years breakdown area of 100, indicating corrective bias while crude oil pared last week's gains and resumed downward momentum.
Nifty Bank : 55510
Technical Outlook
Week that was:
The Bank Nifty closed the day on a positive note, settling at 55,510 up 0.92%. The Nifty PSU Pvt index mirrored the benchmark, ending at 26,779 with a gain of 0.81%..
Technical Outlook:
* Bank Nifty opened on a positive note within the previous session’s range. Throughout the day, intraday dips were consistently bought into, indicating strong demand and absorption of selling pressure. This bullish price action led to a close near the day’s high, resulting in the formation of a bull candle, reflecting underlying strength and positive sentiment.
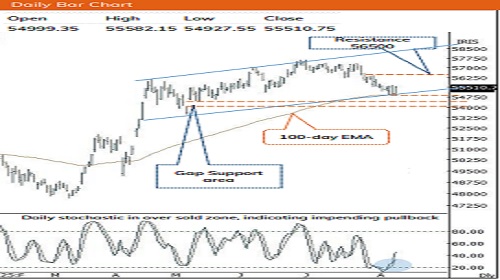
* Key point to highlight is that Bank Nifty has rebounded sharply from a key confluence of support, the 100-day EMA, currently placed at 54,948, and a rising trendline that has held firm since mid-April 2025. This bounce signals a potential pause or reversal in the recent corrective trend. As long as the index sustains above the 54,900-55,000 zone, the broader uptrend remains intact. On the upside, immediate resistance is seen near 56,300-56,500, which also marks the 50% retracement of the recent decline from 57,628 to 54,905. However, if the index fails to hold above 54,900, an extended correction may unfold. In that case, the previous gap support zone between 54,054-54,445 is expected to offer a meaningful downside cushion. From a momentum perspective, the weekly stochastic oscillator has entered oversold territory at 11, suggesting that selling pressure may be nearing exhaustion. In the near term, we expect the bias remains sideways to downward as the index continues to trade within a weekly lower-high, lower-low structure. A decisive close above the previous week’s high, ideally supported by strong volume, would be an early signal of strength. This could help the index recover recent losses and potentially accelerate the move towards resistance near 56,500 in the coming weeks . A decisive breakout above 56,500 would likely mark the start of the next leg of the uptrend.
* Since April, intermediate corrections have remained shallow while the index has consistently held above its 100-day EMA. Moreover, over the past eleven weeks, the index has retraced 50% of the preceding 11.10% up move seen in the prior six weeks. The slower pace of retracement highlights a robust price structure, which augurs well for the next leg of the uptrend.
* The PSU Bank Index outperformed the benchmark and closed on a positive note with a gain of 2.20%, The index has formed a bullish engulfing pattern on the daily chart, signaling a potential reversal and continuation of the uptrend. This pattern appeared at a key confluence point, the lower trendline of an ascending channel and the 100-day EMA, which has held firm since May 2025 despite recent tariff-related volatility. This suggests a potential move toward the upper channel resistance near 7,250. The index continues to trade above its 200-day EMA and the 50% retracement level of the preceding rally (from 6065 to 7305), with both offering a meaningful downside cushion around 6685. This level has acted as a key support since May. According to Dow Theory, the index maintains a higher-high, higher-low structure since its breakout on May 19, with immediate support now seen around 6,700, which aligns with the 20- week EMA. While the Bank Nifty consolidates within 5% of its all-time high, PSU Banks continue to lag significantly, trading 16% below their peak. This presents a potential catch-up opportunity for the sector
Please refer disclaimer at https://secure.icicidirect.com/Content/StaticData/Disclaimer.html
SEBI Registration number INZ000183631


More News

Daily Market Analysis : The Market extended its recovery trend, climbing nearly 1.5% amid po...


