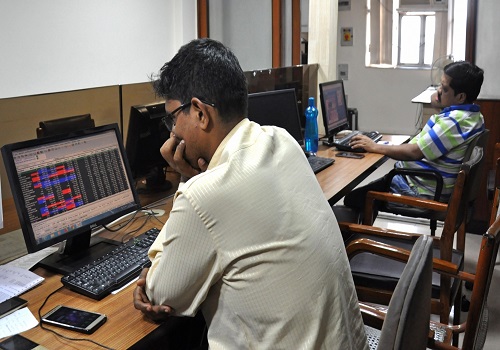
The index started the session with a gap up led by firm global cues however - ICICI Direct

Follow us Now on Telegram ! Get daily 10 - 12 important updates on Business, Finance and Investment. Join our Telegram Channel
Nifty : 21545
Technical Outlook
• The index failed to capitalise initial positive momentum consequently drifted downward as Nifty pared 200 points from days high as the day progressed. The daily price action formed a bear candle confined within Monday’s candle, indicating extended breather amid rise in volatility.
• The index has been facing stiff resistance in the range of 21800. Thus, only a decisive move above 21800 would open the doors for next leg of upward move, else consolidation in the broader range of 21800-21300 wherein stock specific action would prevail as we enter in the Q3 earning season. We believe, ongoing profit booking should not be construed as negative after past two months spectacular up move (16%) which would make market healthy and pave the way for next leg of up move. Thus, focus should be on constructing quality stocks portfolio at lower levels
• Contrary to our expectation, Bank Nifty has breached below past two week’s low of 47400, indicating extended correction which would drag index lower (as Banknifty carries 35% weightage in Nity). Hence, buying on dips would be the prudent strategy to adopt as we believe strong support for the Nifty is placed at 21300.
• The formation of higher peak and trough backed by multi sector participation makes us confident to retain support base at 21300 as its is confluence of: a) 61.8% retracement of recent up move (20977-21834) b) 20 days EMA placed at 21297 c) past two week’s low of 21329

Nifty Bank: 47242
Technical Outlook
• The index started the session with a gap up led by firm global cues however, failed to sustain the gains and surpass previous session highs as sharp sell off in second half led index to close below previous session low and immediate support of 47400 levels signalling extended profit taking towards 46900 levels cannot be ruled out .
• On daily chart, lower high -low formation indicate continuation of profit taking and only sustained close above previous session highs would be first sign of pause in downward momentum
• Structurally, index is undergoing retracement of November – December rally wherein it rallied around 15 % over 9 week period . Couple of weeks consolidation in the broad range of 46500 -48500 would make larger trend healthier and provide fresh entry opportunity . Hence investor should take benefit of ongoing decline to build long positions with focus on PSU banking space which we expect to outperform over medium term

Please refer disclaimer at https://secure.icicidirect.com/Content/StaticData/Disclaimer.html
SEBI Registration number INZ000183631


Top News

KPIT Technologies surges on getting nod for initial strategic acquisition of 13% shareholdin...
Tag News

Weekly Market Wrap by Amol Athawale, VP-Technical Research, Kotak Securities


More News

Market is expected to open on a flattish note and likely to witness range bound move during ...


