Technical Stock Call : Nuvama Wealth Management & Tata Investment Corporation by Bharat K Gala, Ventura

Nuvama Wealth Management Ltd – Technical Stock Call – 13/10/2026

View - Medium Term Bullish
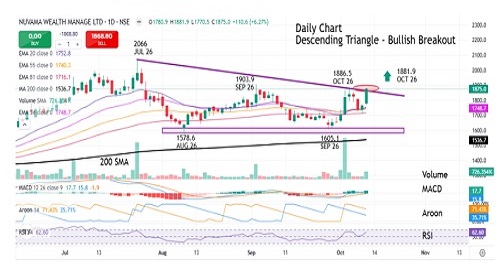
The stock commenced its downtrend from 2066 (JUL 26).
Forming down gaps & lower tops, the stock started trading below the averages gradually reaching a low of 1578.60 (AUG 26).
Later, the stock attracted buying interest at lower levels & commenced its up move marking a high of 1903.9 (SEP 26), but faced resistance in that area & witnessed a minor correction reaching a low of 1605.1 (SEP 26).
Again the stock rallied upwards hitting a high of 1886.5 (OCT 26) & recently, after forming higher bottoms, the stock has given a Descending Triangle - Bullish Breakout on the daily chart supported by volumes with a bullish candle reaching to a high of 1881.9 (OCT 26), which is higher than the previous few sessions high.
Upwards price breakout from a descending triangle is usually a bullish reversal, suggesting sellers are losing control against strong buyer's demand.
Indicators like RSI, MACD, & Argon suggests positive crossover. The stock is trading above 200 SMA.
Target of 2400 is expected with lower support levels at (1815-1770)-1740-(1705-1665) in case of intermediate fall. A stop loss at 1605 is to be followed for the trade.
All the calls/opinions are subject to Disclosures and Disclaimer http://goo.gl/8bCMyQ
Tata Investment Corporation Ltd – Technical Stock Call – 13/10/2026

View - Short Term Bullish
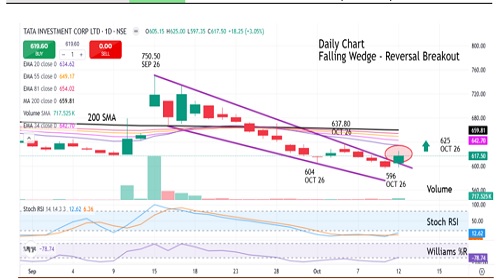
The stock commenced its downtrend from 750.50 (SEP 26).
The stock started trading below its key moving averages and breached the 200 SMA, indicating weakness in the prevailing trend... Thereafter, the stock continued to form lower lows, extending its decline to mark a low of 596 (OCT 26).
During the correction phase, the stock traded within a descending channel, consolidating in a narrow range between 637.80 & 596 during the month OCT 26.
Later, the stock attracted buying interest at lower levels, commenced its up move & recently, after forming higher bottoms, the stock has given a Falling Wedge - Reversal Breakout on the daily chart supported by volumes with a bullish candle reaching to a high of 625 (OCT 26), which is higher than the previous few days high.
Stoch RSI & Williams %R indicators suggest Positive crossover. This breakout indicates improving buying momentum and a potential shift in the short-term trend.
SMS subject to Disclosures and Disclaimer goo.gl/8bCMyQ
SEBI Registration No.: INH000001634