Strong bidding in the USDINR pair pushed it higher towards 83.43 - Axis Securities

Follow us Now on Telegram ! Get daily 10 - 12 important updates on Business, Finance and Investment. Join our Telegram Channel
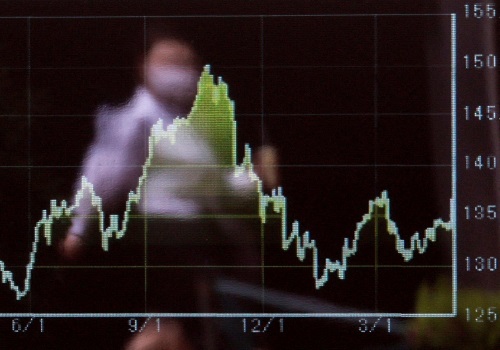
USD/INR
Strong bidding in the USDINR pair pushed it higher towards 83.43
The pair opened on a positive note and continued to drift higher though out the session.
On the daily chart we can the pair faced rejection around the 83.45 mark.
The RSI plotted on the daily chart can be seen moving higher towards the overbought zone, increasing bullish momentum. Technically, we might see the pair find resistance near the 83.50 zone.
On the downside the immediate support is placed near the 83.20-83.10 mark.

EUR/INR
The dollar moved between gains and losses throughout the session, lead to the EURINR pair moving between gains and losses.
After a negative open, in the first half of the session, the pair drifted higher, but towards the end of the session, there was a major sell off which pushed the pair lower towards 91.70 On the daily chart the pair formed a bearish candle with a long upper wick, indicating rejection 92.10 zone.
The RSI plotted on the daily chart can be seen moving lower, indicating increasing bearish momentum in the pair.
Going by the price action the pair has broken below the 92.00 mark, so in the sessions to come we might see a drift lower towards 91.50 zone.
On the downside the upside the immediate resistance is placed near the 92.10-92.30 zone.

USD/JPY
The rise in the US 10 year bond yields and the Dollar index pushed the USDJPY pair higher, which put a lot of pressure on the JPYINR.
On the daily chart we can see that the pair consolidated for the 3 rd session in a line.
On the daily chart we can see that the JPYINR pair has been trading between 59.30 and on the downside the immediate support is placed near 58.95
The RSI plotted on the daily chart can be seen flattening, indicating lack of momentum in the pair.
In the sessions to come we might see the pair find resistance near the 59.30. On the downside 58.95 is expected to act as an immediate support.

GBP/INR
The pound was very volatile during the day, in the first half of the session, we saw the pound make a strong move higher to 106.40 until the pair saw a strong sell off which pushed it lower towards the end of the session.
On the daily chart we can see that the pair formed a bearish candle with a long lower wick, indicating major rejection near the 106.40 zone.
The RSI plotted on the daily chart can be seen drifting lower, indicating increasing bearish momentum in the pair. In the sessions to come we might see 106.40 act as a resistance.
On the downside the immediate support is placed near the 105.50-105.30 zone.

For More Axis Securities Disclaimer https://simplehai.axisdirect.in/disclaimer-home
SEBI Registration number is INZ000161633