Silver Surges 129% YoY, Microcaps Gain 2.96% While Nifty 50 Slips 1.87% – Motilal Oswal Mutual Fund

According to Motilal Oswal Mutual Fund’s Global Market Snapshot report, Indian equity markets displayed mixed performance in May 2026, with broader market segments continuing to outperform large-cap stocks. The Nifty 50 declined 1.87% over the last one month. The index fell 6.48% over three months, 10.13% over six months, and 4.86% on a one-year basis. The Nifty Next 50 gained 2.05% over the month, while delivering returns of 1.95% over three months, 2.80% over six months, and 6.46% over one year. The Nifty Midcap 150 increased 2.60% over the last one month and posted returns of 3.31% over three months, 0.79% over six months, and 6.84% over one year. The Nifty Smallcap 250 advanced 1.56% over the month, with returns of 7.00% over three months, 1.55% over six months, and 0.94% over one year. The Nifty Microcap 250 rose 2.96% over the last one month and delivered returns of 11.01% over three months, 2.29% over six months, and 0.67% over one year. The Nifty 500 slipped 0.12% over the month, while posting returns of -2.20% over three months, -5.33% over six months, and -0.64% over one year.
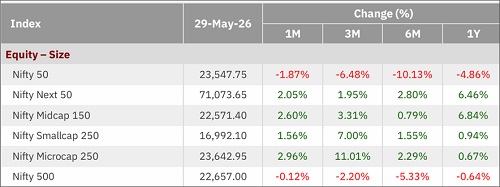
Large caps faced mild pressure, with Nifty 50 declining 1.87% in May. Broader markets showed a mixed picture, with Nifty Next 50 and Midcap 150 gaining 2.05% and 2.60% respectively, while Nifty 500 was down by 0.12%.
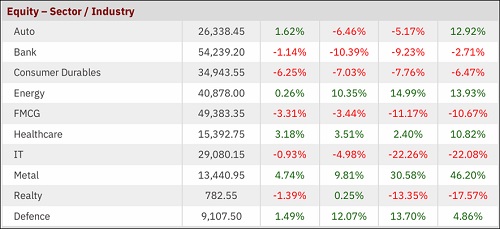
Sectorally, Metal and Healthcare led with gains of 4.74% and 3.18%,Consumer Durables and Fast Moving Consumer Goods also saw notable weakness of -6.25% and -3.31% respectively. Defence and Auto sector has also led with gains of 1.49% and 1.62% respectively. Metal sector however has seen a 46.20% gain \ and the IT sector has seen a fall of 22.08% over the past year.
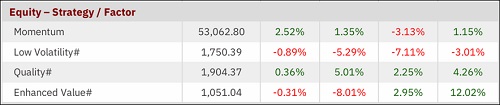
Factor indices reflected a momentum-driven market — Momentum led with a strong 2.52% gain, while Quality managed a modest 0.36% rise. Enhanced Value was down by 0.31% and Low Volatility was the weakest performer at -0.89%.
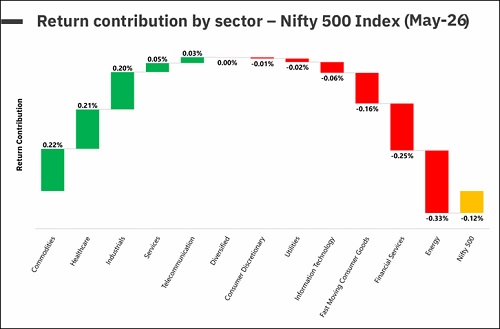
Nifty 500 was down by 0.12% in May, dragged largely by Financial Services, Energy, and Fast Moving Consumer Goods sectors, even as Commodities, Healthcare, and Industrials stayed positive.
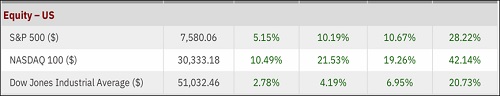
S&P 500 gained 5.15% in May, driven largely by Information Technology which contributed 5.57% to index returns, while Consumer Discretionary and Healthcare added modestly. Emerging markets showed a sharp contrast — Korea and Taiwan surged 35.22% and 16.53%, while China was down by 3.41% and Brazil fell 9.25%. Developed markets were broadly positive; Japan gained 4.93% and Germany 1.65%, while UK edged lower by 0.75% and France saw limited movement.
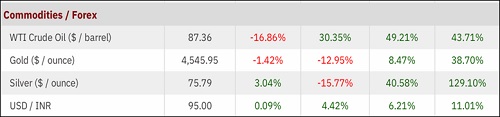
Crude oil fell sharply by 16.86% in the month, touching $87/barrel, while Gold dipped 1.42% to $4,547/oz. USD/INR remained nearly flat with a 0.09% move. Crypto markets saw opposite moves — Ethereum held broadly flat at +0.98% while Bitcoin was down by 3.61%, with both remaining lower over the preceding six-month period.
Quick Take
India
CPI inflation edged up to 3.48% from 3.40%, while the repo rate held steady at 5.25% and the 10-year yield eased slightly to 7.00%.
FII outflows stood at ?29,484 crore, with DII flows also turning negative at ?10,308 crore, indicating relatively cautious positioning from domestic investors as well.
US
CPI inflation rose to 3.80% from 3.30%, even as the Fed kept rates unchanged at 3.75%.
US Tax Receipts jumped to $837 Bn from $385 Bn one month prior, while the 10-year yield ticked up to 4.44%.
Above views are of the author and not of the website kindly read disclaimer