
NII Lifts Bank PPOP 12.8% in Q2FY27 Despite Lower Treasury and Higher Costs by CareEdge Ratings

Synopsis
• Pre-provision operating profit (PPOP) of select scheduled commercial banks (SCBs) grew 12.8% y-o-y to Rs 1.07 lakh crore in Q2FY27, up from 7.1% in Q1FY27. Net interest income (NII), which grew 15.9%, drove the increase. Part of the faster growth also reflects a weak Q2FY26, when PPOP had grown only 2.9%.
• NII growth came mostly from larger balance sheets: average assets grew 14.4% y-o-y, while NIM rose only 4 bps to 2.98%. Total assets rose 6.4% q-o-q, against 1.0% in Q1FY27, helped by FCNR(B) deposits raised during the quarter, which drew about USD 133 billion across the banking system.
• PSB net interest margin (NIM) rose 15 bps y-o-y to 2.58%, as PSBs moved funds from bonds into loans and replaced costlier bulk deposits. PVB NIM fell 8 bps y-o-y to 3.29%. Loan yields fell 42 bps as repo rate cuts passed through quickly, while funding costs fell 18 bps, as more deposit growth came from costlier term deposits. Low-margin loans against FCNR(B) deposits added to the pressure.
• PPOP margin (PPOP as a share of average total assets) slipped 4 bps y-o-y to 2.30%, as lower treasury income offset higher NII. It fell 10 bps to 2.62% at PVBs and held at 1.89% at PSBs. The cost-to-income ratio improved 119 bps y-o-y to 44.9%, as net total income grew 9.8% against 7.0% for operating expenses, but rose 38 bps q-o-q.
• Treasury income fell 61.6% y-o-y (65.7% at PVBs and 59.4% at PSBs), as higher bond yields at the end of the quarter led to mark-to-market losses and left banks fewer chances to sell bonds at a profit. Fee income grew 12.5% and accounted for about 71% of other income, up from 61% a year ago, mainly because treasury income shrank. Operating expenses rose 7.0% as banks added branches, staff and technology.
• Net profit grew 14.0% y-o-y, faster than PPOP, as PVB provisions fell 18.4%. PSB net profit grew 8.3%, slower than PPOP, mainly because of a high base at one PSB, whose Q2FY26 profit included the gain on the sale of NSDL shares, a provision write-back and a low tax outgo. Excluding it, PSB net profit grew faster than PPOP. We expect PPOP growth to stay in double digits over the next two quarters, supported by the October repo rate hike and a weak base, though weak treasury income and rising costs will limit the gain.
According to Saurabh Bhalerao, Director, CareEdge Ratings, “Operating profit growth rose to 12.8% in Q2FY27 from 7.1% in Q1FY27, mainly because bank balance sheets grew quickly, helped by FCNR(B) inflows and a weak base, while margins added little. PVB margins fell as rate cuts passed through faster to loan yields and lowspread loans against FCNR(B) deposits diluted returns, while PSB margins rose as they replaced costly bulk deposits and moved funds from bonds into loans. The 25-bps repo rate hike in October 2026 should lift yields on repo-linked loans faster than deposit costs. We expect PSB margins to hold or improve in Q3FY27, and PVB margins to recover from Q4FY27. In Q3FY27, gains from deploying surplus FCNR(B) funds and from the rate hike are likely to be offset by a full quarter of interest on the FCNR(B) deposits raised in Q2FY27, most of which were lent at thin spreads. PPOP growth is likely to stay in double digits over the next two quarters, supported by the rate hike and a weak base, though weak treasury income and rising costs will limit the gain.”
Key Highlights

PPOP Rises 12.8% y-o-y While Net Interest Income Grows 15.9%
PPOP of select SCBs rose 12.8% y-o-y in Q2FY27, up from 7.1% in Q1FY27, excluding one-off items. NII drove the increase: it was about Rs 19,100 crore higher than in Q2FY26. Other income fell about Rs 1,700 crore, as treasury income fell about Rs 6,600 crore, and operating expenses rose about Rs 5,700 crore. Part of the faster growth also reflects a weak Q2FY26, when PPOP grew only 2.9% y-o-y excluding one-offs, as NII grew just 2.5% while margins shrank after the first rate cuts. Sequentially, PPOP rose 2.2% excluding one-offs (3.5% as reported).
PPOP by Bank Group (Rs crore)
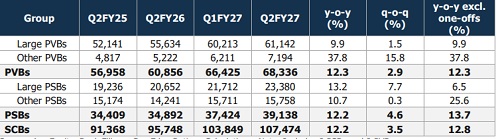
On a y-o-y basis, PSBs grew PPOP by 13.7% excluding one-offs, against 12.3% for PVBs; on reported figures, the two groups grew at about the same pace. PSBs gained because their NII grew faster (18.4% y-o-y vs 14.4% for PVBs) and their operating expenses grew more slowly (5.5% vs 8.1%). This lead is narrow.
PPOP growth varied more within each group than between them. Other PSBs grew 25.6% y-o-y on strong loan growth and cheaper funding, while large PSBs grew only 6.5% as treasury income and recoveries from written-off accounts fell at two of the three banks. Other PVBs grew 37.8% y-o-y on better margins and tight cost control, helped at one bank by a large capital infusion, which reduced its need for costly borrowing. Large PVBs grew 9.9%, as low-margin FCNR(B)-linked lending and a sharp fall in treasury income offset healthy loan growth.
FCNR(B) Deposits Lift Bank Assets 6.4% in One Quarter, but at Thin Margins
The RBI opened a USD-INR swap window for fresh FCNR(B) deposits on June 8, 2026, to attract foreign currency inflows and support the rupee. Deposits raised under it were exempt from CRR and SLR, and banks could swap the dollars with the RBI for rupees. The window drew USD 133 billion before it closed early on August 31. SCB deposit growth rose to 17.3% y-o-y by mid-September, close to credit growth of 18.1%. Total assets of select banks rose 6.4% q-o-q in Q2FY27, against 1.0% in Q1FY27 and 1.9% in Q2FY26.
Banks used these funds in different ways. The large PVBs lent most of their FCNR(B) money back to the same nonresident customers as dollar loans through their overseas and GIFT City branches. Loans and deposits both rose, but such loans earn a spread of only about 40 to 50 bps. The three large PVBs raised about Rs 3.7 to 3.8 lakh crore in FCNR(B) deposits, accounting for over 80% of the quarter's deposit growth. At two of them, reported loan growth would have been 400 to 600 bps lower without these loans. Several PSBs with overseas branches also lent part of their funds this way. Banks also borrowed abroad to fund part of these loans, and borrowings of select SCBs rose 20.9% q-o-q.
PSBs raised smaller amounts and used a larger share of them to repay bulk deposits and certificates of deposit, which cost about 100 bps more than FCNR(B) deposits. This lowered their funding cost without adding much to their balance sheets. The 47-bps fall in 3-month certificate of deposit yields in September reflects this lower demand for short-term market funding.
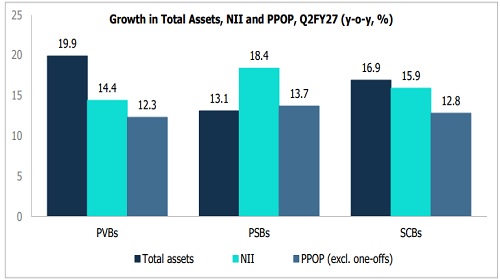
This difference explains the earnings pattern. At PVBs, assets grew 19.9% y-o-y, but NII grew only 14.4% and PPOP 12.3%, so PPOP as a share of average assets fell to 2.62% from 2.72% a year ago. Low-margin FCNR(B) related loans were one reason; the faster pass-through of rate cuts to loan yields and a shift to costlier term deposits were the others. At PSBs, NII grew 18.4%, faster than assets (13.1%), and PPOP as a share of average assets held steady at 1.89%.
The boost is likely to be one-off. With the window closed, deposit growth should slow in H2FY27, and banks will again have to fund loan growth mainly through retail deposits. Banks expect to deploy their remaining surplus funds into higher-yielding domestic loans over the next two quarters, which should support margins from Q4FY27.
Cost-to-Income Ratio Improves 119 bps y-o-y to 44.9% but Edges Up Sequentially
Between Q2FY26 and Q2FY27, income grew faster than costs. Net total income (NII plus other income) of select SCBs rose 9.8% y-o-y, while their operating expenses rose 7.0%. The gap was wider at PSBs (income 8.8%, costs 5.5%) than at PVBs (income 10.4%, costs 8.1%), as PSB staff costs rose only slowly. As a result, the PSB ratio is now about 505 bps above the PVB ratio, against about 565 bps a year ago.
Above views are of the author and not of the website kindly read disclaimer