Nifty and Bank Nifty Weekly Outlook by Hardik Matalia, Derivative Analyst, Choice Broking Ltd

BANKNIFTY
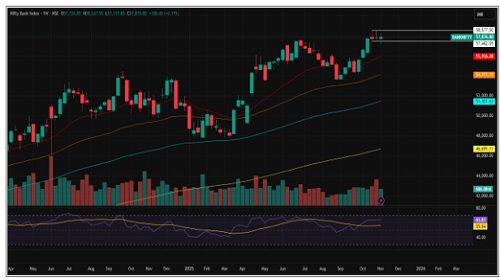
The Bank Nifty index closed the week at 57,876.80, up 0.17% from the previous week’s close. On the weekly chart, the index shows signs of indecision, reflecting a tussle between buyers and sellers. The index ended the week above the 57,800 mark, indicating stability but lack of clear direction. Overall, the setup suggests a sideways to consolidation phase until a decisive breakout occurs on either side.
This week, the Bank Nifty index formed a Doji candle on the daily chart, indicating indecision in the market. Buying interest was observed in PSU banks, while private banking stocks showed some hesitation. As long as the index remains below the 58,500 mark, it is likely to trade in a range-bound manner. Overall, the setup suggests a sideways to consolidation phase in the near term.
On the weekly timeframe, the Bank Nifty index continues to trade comfortably above all its key moving averages—including the short-term 20-day, medium-term 50-day, and long-term 200-day EMAs—indicating a broadly positive structure. The index witnessed buying from lower levels but also faced some pressure at higher zones, reflecting a lack of clear directional bias. Key downside support is placed at 57,500, followed by 57,000, while upside resistance is seen at 58,000 and 58,500. Overall, the view remains sideways until the index decisively breaks out on either side.
If the index continues to move higher, ICICI Bank & HDFC Bank from the private banking sector is expected to support the uptrend. Similarly, in the public sector banking space, SBIN & CANBK is anticipated to show strength and contribute to any potential upside.
For the ongoing expiry, the maximum Call Open Interest (OI) is concentrated at the 58,000 strike, followed by 58,500, indicating strong resistance at higher levels. On the other hand, the maximum Put Open Interest (OI) is seen at the 57,500 strike, followed by 57,000, marking these as key support zones. This setup suggests that the Bank Nifty may continue to trade within a defined range, and traders should wait for a decisive breakout on either side before taking directional positions.
Support: 57500-57000
Resistance: 58000-58500
Bias- Sideways
NIFTY
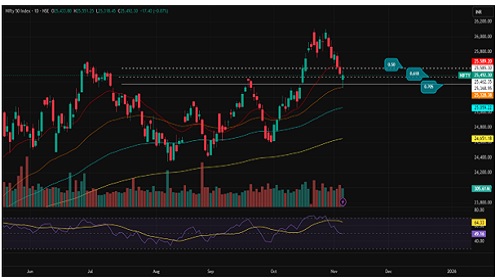
The Nifty index closed the week at 25,492.30, marking a 0.89% decline from the previous week’s close. On the weekly chart, the index shows signs of mild pressure, as it failed to sustain above the 25,500 mark. This setup indicates that the market may enter a sideways to consolidating phase in the near term.
This week, a bearish-bodied candle with a lower wick and a small upper wick was formed, indicating selling pressure at higher levels. The price action reflects a sideways to consolidation phase, as the index failed to hold its higher levels and ended the week below the 25,500 mark. This setup suggests the possibility of continued consolidation or sideways movement in the near term.
On the weekly timeframe, the Nifty is trading above all its key Exponential Moving Averages (EMAs) — including the short-term (20-week), medium-term (50-week), and long-term (200-week) EMAs. This alignment continues to indicate a strong underlying uptrend, suggesting that the index remains well-supported on dips. However, the Relative Strength Index (RSI) stands at 57.30, reflecting a sideways trend and indicating that momentum has flattened out, hinting at a possible pause or consolidation phase before the next directional move.
In terms of levels, the Nifty has immediate support at 25,400 and 25,300, which could provide buying opportunities on declines. On the upside, resistance is seen at 25,600 and 25,700, with the latter acting as a key hurdle. A sustained breakout above 25,800 could trigger a bullish move, potentially targeting the 26,000–26,200 zone in the coming weeks.
The India VIX rose by 3.33% during the week to close at 12.5575, indicating a slight uptick in market volatility. In the derivatives segment, the maximum Call Open Interest (OI) is concentrated at the 25,600–25,700 strike levels, suggesting strong resistance at higher zones. On the downside, the maximum Put Open Interest (OI) is seen at the 25,400–25,300 strike levels, highlighting key support areas. Overall, the setup indicates a sideways-to-range-bound trend, with a positive undertone as long as the index sustains above its crucial support levels.
Support: 25400 - 25300
Resistance: 25600-25700
Bias: Sideways
For Detailed Report With Disclaimer Visit. https://choicebroking.in/disclaimer
SEBI Registration no.: INZ 000160131