

Nifty and Bank Nifty Outlook 4th Jan 2026 by Amruta Shinde, Technical & Derivative analyst, Choice Broking

NIFTY WEEKLY OUTLOOK
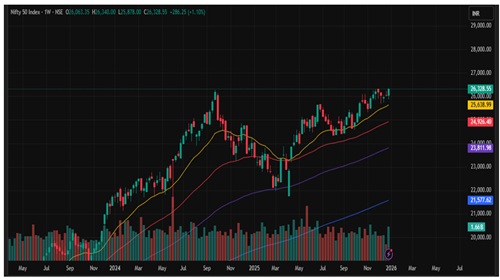
The Nifty index displayed strong bullish momentum this week, rebounding sharply after a negative start and closing with a gain of 286 points to register a fresh all-time high of 26,340. On the weekly chart, the index has formed a strong bullish candle at lifetime highs, indicating sustained buying interest and continuation of the prevailing uptrend.
On the daily timeframe, Nifty recorded a decisive close above the crucial 26,300 resistance level, ending the session at 26,328.55, which reflects strong follow-through buying and confirms a bullish breakout. The index continues to trade comfortably above its key moving averages—the 20-day, 50-day, and 200-day EMAs—thereby reinforcing the broader bullish undertone. As long as Nifty sustains above these levels, market sentiment is expected to remain constructive and upward-biased.
On the upside, immediate resistance is placed at 26,400, followed by 26,500 and 26,600, while on the downside, support is seen at 26,200 and then at 26,100. A deeper breakdown below 26,000 could invite additional downside pressure. Given the current market structure, a buy-on-dips strategy remains appropriate; however, traders should remain disciplined and adhere to strict stop-losses in view of ongoing market volatility.
Support Levels:- 26200-26000
Resistance Levels :- 26400-26600
Overall Bias :-Bullish
BANKNIFTY WEEKLY OUTLOOK
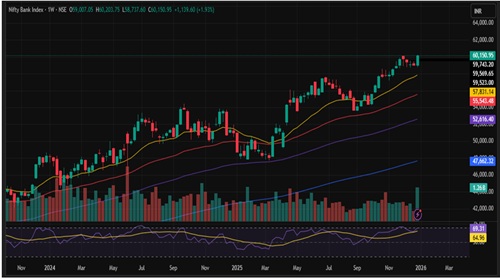
Bank Nifty ended the session with sustained bullish momentum, scaling a fresh all-time high of 60,203 and gaining 439 points before closing the week at 60,150.95, indicating strong buying interest and broad-based participation. The index has closed in the green for four consecutive sessions, suggesting a healthy continuation of the ongoing uptrend and improving short-term sentiment.
However, if selling pressure re-emerges and the index decisively breaks below the 59,900 mark, it could open the door for a deeper corrective move toward the 59,700–59,500 zone, with the possibility of further downside if weakness intensifies. On the upside, immediate resistance is placed at 60,300, followed by 60,500 and 60,700. The weekly RSI stands at 69.31 and continues to trend higher, reflecting strengthening momentum while approaching the overbought zone.
The index remains comfortably above its 20-day, 50-day, and 200-day EMAs, reinforcing a structurally positive setup that favors continuation of the broader uptrend. A decisive close above 60,300 would further strengthen bullish momentum and pave the way for additional upside, whereas failure to sustain above this level could lead to short-term consolidation or mild weakness. Traders are advised to remain constructive yet disciplined, closely monitoring 59,900 on the downside and 60,300 on the upside to assess the next directional move.
Support: 59900-59500
Resistance: 60300-60700
Bias :- Bullish
For Detailed Report With Disclaimer Visit. https://choicebroking.in/disclaimer
SEBI Registration no.: INZ 000160131


More News
Debt Monthly Observer -July 2026 by Sneha Pandey, Fund Manager, Fixed Income, Quantum AMC


