Nifty and Bank Nifty Outlook 10th May 2026 by Aakash Shah, Technical Research Analyst, Choice Broking

NIFTY WEEKLY OUTLOOK
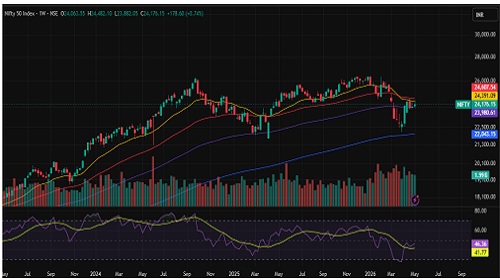
The Nifty index started the week with a modest gap-up of around 66 points, opening at 24,063.55. Following the positive opening, the index witnessed some profit booking and moved slightly lower to form a weekly low of 23,882.05, suggesting cautious sentiment at higher levels. However, the index staged a recovery from the weekly low and climbed to a weekly high of 24,482.10, showcasing resilience and renewed buying interest. By the end of the week, the index settled at 24,176.15, registering a gain of 178.60 points or 0.74%. The index also corrected nearly 300 points from the weekly high, resulting in the formation of a long upper wick candle, which indicates profit booking and selling pressure emerging at higher levels.
Overall, the price action suggests that the index continues to maintain a positive undertone, although resistance near higher levels is restricting further upside momentum. On the upside, resistance levels are placed at 24,500 and 24,600. On the downside, support is seen at 24,000 and 23,800. A breakdown below 23,800 could result in increased selling pressure. Given the current market structure, traders are advised to remain disciplined and adhere to strict stop-loss strategies amid ongoing volatility.
Support Levels :- 24,000-23,800
Resistance Levels :- 24,500 – 24,600
Overall Bias :- Sideway
BANKNIFTY WEEKLY OUTLOOK
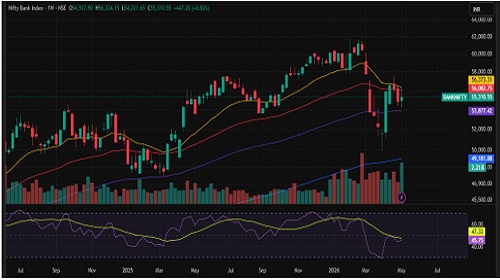
The Bank Nifty index opened the session on a flat note at 54,937.90, reflecting initial indecision among market participants. The index declined to mark a weekly low of 54,221.65 before witnessing a recovery, eventually touching a weekly high of 56,334.15, which coincided with the 20-week EMA. However, it failed to sustain at higher levels and finally settled at 55,310.55, gaining 447.20 points or 0.82% for the week, suggesting selective buying interest at lower levels. This price action indicates continued volatility with a cautious undertone in the broader trend.
It is also noteworthy that on the daily chart index briefly slipped below its 20-DEMA and the 50-day EMA, signalling weakness in short-term momentum and persistent selling pressure at higher levels. In the near term, immediate downside support is placed in the 54,600–54,200 zone in case selling pressure re-emerges. On the upside, 56,400 acts as immediate resistance, while 56,800 stands as the next key supply zone.
From a momentum standpoint, the weekly RSI at 45.75 indicates subdued momentum with a neutral-to-negative bias. However, failure to reclaim higher levels may keep the index under short-term corrective pressure. Traders are advised to remain cautious and follow disciplined risk management while closely tracking key levels for the next directional move.
Support: 54,600–54,200
Resistance : 56,400-56,800
Overall Bias :- Sideways
For Detailed Report With Disclaimer Visit. https://choicebroking.in/disclaimer
SEBI Registration no.: INZ 000160131


Tag News
Market Round-up - 14th July 2026 by Motilal Oswal Wealth Mangement