Momentum Picks : Buy Strides Pharma Science Ltd For Target Rs. 887-925 - Axis Securities Ltd
Strides Pharma Science Ltd
Buy Strides Pharma Science Ltd CMP 775 Range 760-745 Trend Reversal 685 Gain 18%-23% Target 887-925
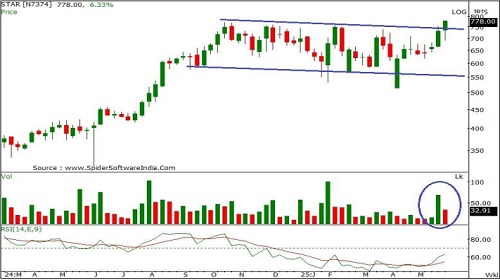
• STAR has delivered a decisive breakout above the falling channel at 750 on the weekly chart, marked by a strong bullish candle and a surge in volumes, underscoring robust market participation and confirming the start of a medium-term uptrend.
• Additionally, the stock has crossed above the weekly upper Bollinger Band, generating a technical buy signal and adding further conviction to the breakout.
• The weekly RSI is trending higher, holding above its 50 mark and reference line, signalling strengthening momentum.
• A breakout above the RSI’s downward-sloping trendline further reinforces the bullish setup.
• With this setup, STAR appears well-poised to extend its upward move, with near-term upside targets at 887 and 925
Technical Terminology:
• Falling channel breakout: A falling channel breakout occurs when the price decisively moves above the upper boundary of a downward-sloping channel, signalling a potential trend reversal or continuation of an uptrend. This breakout is typically accompanied by increased volume and momentum indicators turning bullish, adding strength to the breakout signal.
• Upper Bollinger band breakout: The stock has registered a Bollinger Band breakout, breaking above the upper band, indicating heightened bullish volatility. Such a breakout often signals the start of a strong directional move, supported by expanding price range and momentum.
• RSI: The Relative Strength Index (RSI) is a momentum indicator used in technical analysis. It measures the speed and magnitude of a security's recent price changes to evaluate whether the price of that security is overvalued or undervalued.
• RSI crosses above downward sloping trendline: When the RSI breaks above a downward-sloping trendline, it signals a shift in momentum from bearish to bullish. This breakout often precedes or confirms an up move in prices, reinforcing the strength of the underlying trend reversal.
For More Axis Securities Disclaimer https://simplehai.axisdirect.in/disclaimer-home
SEBI Registration number is INZ000161633