Gold trading range for the day is 71230-72970 - Kedia Advisory

Follow us Now on Telegram ! Get daily 10 - 12 important updates on Business, Finance and Investment. Join our Telegram Channel
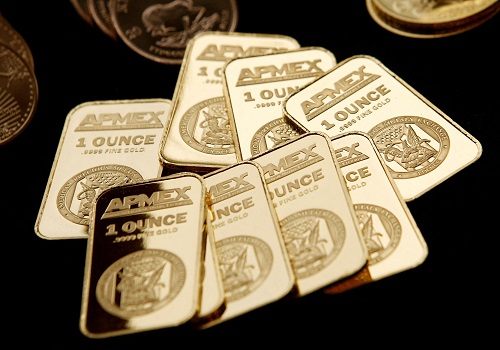
Gold
Gold prices experienced a slight decline of -0.29%, settling at 71997, influenced by a firmer dollar as investors awaited U.S. jobs data that could impact the Federal Reserve's interest rate decisions. Weak U.S. manufacturing and construction spending data contributed to this sentiment, prompting investors to seek cues from upcoming central bank meetings and key economic indicators. The European Central Bank and the Bank of Canada are anticipated to cut rates this week, preceding the Federal Open Market Committee (FOMC) meeting next week. Swiss gold exports in April fluctuated due to varying demands from key markets. While exports to India surged to their highest level since February, exports to China and Hong Kong declined, reflecting changing consumption patterns. In China, gold imports via Hong Kong dropped significantly in April compared to March, signaling a shift from the robust consumption witnessed in the first quarter of the year. Despite high prices, retail demand for physical gold waned in most Asian hubs, leading Indian dealers to offer discounts for a fourth consecutive week. Subdued demand during the summer wedding season further dampened activity in the Indian market. In China, premiums over benchmark spot prices widened compared to the previous week, while in Singapore and Hong Kong, gold was sold at slight premiums. In Japan, bullion prices remained stable with minimal premiums. From a technical standpoint, the gold market observed long liquidation, evidenced by a drop in open interest by -1.86% to 16,592 contracts, coupled with a price decrease of -206 rupees. Support for gold is seen at 71550, with potential to test 71100 levels below this support. Resistance is expected at 72505, and a move above could lead to prices testing 73010.
Trading Ideas:
* Gold trading range for the day is 71100-73010.
* Gold dropped as the dollar firmed, while investors positioned for U.S. jobs numbers
* U.S. manufacturing activity slowed for a second straight month in May
* The Federal Reserve Bank of New York said that underlying inflation pressures eased slightly in April.
Silver
Silver prices fell by 2.58% to settle at 89,659, influenced by market assessments of central bank rate outlooks and the industrial demand landscape for key silver consumers. The U.S. imposed a 50% tariff on Chinese solar cell imports, a significant industry for silver usage, impacting demand for panels produced in Southeast Asia factories. However, robust demand in China helped limit further declines, highlighted by the recent activation of the world’s largest solar farm in Xinjiang. Additionally, expectations of imminent interest rate cuts by major central banks have eased the opportunity cost of holding non-yielding silver assets. The European Central Bank (ECB) and the Bank of Canada (BoC) are anticipated to lower rates in their upcoming meetings, while the Federal Reserve (Fed), the Bank of England (BoE), and the People's Bank of China (PBoC) are expected to follow suit in the third quarter. India’s silver imports have surged significantly, already exceeding the total imports for all of 2023 within the first four months of this year. This increase is driven by heightened demand from the solar panel industry and investors betting on silver outperforming gold. India, the largest consumer of silver, imported a record 4,172 metric tons from January to April, compared to just 455 tons during the same period last year. Technically, the silver market is experiencing long liquidation, with a 7.89% drop in open interest to settle at 22,839 contracts as prices fell by 2,374 rupees. Silver finds support at 88,350, with potential testing of 87,040 if it dips below this level. Resistance is anticipated at 91,870, and a move above this level could see prices testing 94,080.
Trading Ideas:
* Silver trading range for the day is 87040-94080.
* Silver prices fell as markets continued to assess the rate outlook for major central.
* However, strong demand in the domestic Chinese markets prevented a further drop.
* India's silver imports exceeded total for all of 2023 in the first four months of the year.
Crude oil
Crude oil prices experienced a slight decline of -0.23%, settling at 6167, amid uncertainty surrounding OPEC+'s decision to increase supply later this year in a market already exhibiting signs of weak demand. The complex deal brokered by OPEC+ entails extending most of its deep oil output cuts until 2025 to stabilize the market amidst tepid demand growth, high interest rates, and escalating U.S. production. Currently, OPEC+ members are collectively cutting output by 5.86 million barrels per day (bpd), approximately 5.7% of global demand. The agreement extends cuts of 3.66 million bpd until the end of 2025 and prolongs cuts of 2.2 million bpd until September 2024. OPEC+ plans to gradually phase out the 2.2 million bpd cuts from October 2024 to September 2025. However, concerns linger over the balance between supply and demand, with differing estimates from OPEC and the International Energy Agency regarding demand for OPEC+ oil plus stocks. In the U.S., money managers increased their net long U.S. crude futures and options positions, reflecting bullish sentiment. Despite this, U.S. crude production rose to its highest level this year in March, reaching 13.2 million bpd. However, product supplied fell, suggesting potential shifts in consumption patterns. Inventory data from the U.S. Energy Information Administration revealed a significant decrease in crude oil stocks, exceeding market expectations. From a technical perspective, the crude oil market observed long liquidation, with a drop in open interest by -7.23% to 15,755 contracts, coupled with a price decrease of -14 rupees. Support for crude oil is seen at 6101, with a potential test of 6036 levels below this support. Resistance is anticipated at 6203, with prices possibly testing 6240 upon surpassing this level.
Trading Ideas:
* Crudeoil trading range for the day is 6036-6240.
* Crude oil inches lower as investors weigh up extended OPEC+ supply cuts
* OPEC+ extends deep oil production cuts into 2025
* OPEC expects demand for OPEC+ crude to average 43.65 million bpd in the second half of 2024
Natural gas
Natural gas prices experienced a decline of 2.49% to settle at 219.6, driven by forecasts indicating lower demand over the next two weeks compared to previous expectations. Additionally, the market witnessed a notable oversupply of gas stored in U.S. facilities, further pressuring prices downward. Despite a preliminary decrease in output to a 19-week low, prices eased, with daily output averaging 98.1 billion cubic feet per day (bcfd) in June, matching May's figures. The reduction in output comes after a period of heightened activity, spurred by a significant increase in futures prices of 47% during April and May. However, despite this recent drop, U.S. gas production remains down approximately 9% in 2024 compared to the previous year, as energy firms like EQT and Chesapeake Energy delayed well completions and reduced drilling activities following the price slump in February and March. Meteorologists project warmer-than-normal weather across the Lower 48 states until June 19, with only a few near-normal days from June 9-11. Meanwhile, U.S. utilities added 84 billion cubic feet of gas into storage during the week ending May 24th, exceeding expectations and marking the eighth consecutive week of seasonal storage increases. Gas stocks totaled 2,795 billion cubic feet, up 15% from the previous year and 26% above the current five-year average. From a technical standpoint, the natural gas market is experiencing long liquidation, with open interest dropping by 0.39% to settle at 16,939 contracts as prices decreased by 5.6 rupees. Support is seen at 212.3, with potential testing of 204.9 if prices fall below this level. Resistance is likely at 231.8, and a move above could see prices testing 243.9.
Trading Ideas:
* Naturalgas trading range for the day is 204.9-243.9.
* Natural gas prices eased due to forecasts for less demand over the next two weeks.
* Oversupply of gas in U.S. storage also contributed to price decline.
* Gas output in Lower 48 states rose to an average of 98.1 billion cubic feet per day in June, similar to May.
Copper
Copper prices took a significant hit, dropping by -1.89% to settle at 863.5, primarily due to lackluster demand from China, the top consumer of the metal. Soft U.S. economic data raised expectations for earlier rate cuts by the Federal Reserve, leading to a rebound in the dollar from its mid-March lows. In addition to weak demand, rising copper inventories further dampened market sentiment. LME copper inventories reached a six-week high of 118,950 tonnes, with deliveries to registered warehouses in Taiwan. Meanwhile, Chinese copper inventories remained elevated, indicating a more abundant supply than previously anticipated by traders. Indonesia's decision to impose a 7.5% export tax on copper concentrate shipments added pressure to the market. Although China's daily refined copper production hit record highs, warehouse stocks monitored by the Shanghai Futures Exchange remained near four-year peaks, suggesting surplus conditions. According to the International Copper Study Group (ICSG), the global refined copper market reported a surplus of 125,000 metric tons in March, a decrease from February's surplus of 191,000 metric tons. Despite a slight decrease in surplus, world refined copper output surpassed consumption, contributing to overall market weakness. From a technical standpoint, the copper market observed long liquidation, with a -1.39% drop in open interest to 6,079 contracts, coupled with a price decline of -16.6 rupees. Support for copper is identified at 855.6, with potential for further decline to 847.6 levels below this support. Resistance is anticipated at 878, with a possibility of prices testing 892.4 upon surpassing this level.
Trading Ideas:
* Copper trading range for the day is 847.6-892.4.
* Copper prices dropped due to lacklustre demand in China.
* United States' manufacturing data is weaker than expected.
* Indonesia imposes 7.5% export tax on copper concentrate shipments
Zinc
Zinc prices dipped slightly by 0.11% to settle at 261.6, influenced by a surprising decline in China's manufacturing activity in May. The official purchasing managers' index (PMI) dropped to 49.5 from April's 50.4, signaling contraction in the world's top metals consumer and further dampening demand prospects. China's refined zinc output also experienced a decline in April, totaling 504,600 metric tons, down 3.99% month-on-month and 6.56% year-on-year. However, domestic zinc alloy production saw a slight increase to 95,500 metric tons, reflecting varied dynamics within China's zinc sector. The decrease in output was attributed to routine maintenance of smelters in several provinces, along with equipment and raw material issues in others. Despite these challenges, Chinese authorities introduced significant stimulus measures, including lowering mortgage interest rates, to bolster industrial prospects and instill hopes for interest rate cuts, thereby supporting the commodity's outlook. Internationally, the global zinc market surplus contracted to 52,300 metric tons in March from February's 66,800 tons, as reported by the International Lead and Zinc Study Group (ILZSG). Despite this reduction, the surplus for the first quarter of the year stood at 144,000 tons, compared to 201,000 tons in the same period last year, indicating ongoing oversupply challenges in the global zinc market. Technically, the zinc market experienced long liquidation, with a 1.87% drop in open interest to settle at 2,932 contracts as prices declined by 0.3 rupees. Support levels are identified at 259.5, with potential testing of 257.2 if prices continue to decrease. Resistance is anticipated at 264.6, and a move above this level could lead to prices testing 267.4.
Trading Ideas:
* Zinc trading range for the day is 257.2-267.4.
* Zinc prices dropped as China's manufacturing activity unexpectedly fell in May.
* The global zinc market surplus fell to 52,300 metric tons in March from 66,800 tons in February – ILZSG.
* China's refined zinc output was 504,600 mt, a month-on-month decrease of 20,900 mt or 3.99%.
Aluminium
Aluminium prices saw a marginal uptick of 0.12%, settling at 241.1, despite funds offloading bullish positions amid concerns over the impact of high interest rates on metals demand, particularly in China. Recent shortages of alumina, exacerbated by reduced output from China and disruptions to Rio Tinto's Australian exports, have raised supply concerns. Rio Tinto's declaration of force majeure on alumina cargoes from its Australian refineries further heightened apprehensions about the availability of this crucial material from the world's second-largest producer. In response to tightening supply conditions, one global aluminium producer offered Japanese buyers a premium of $175 per metric ton for July-September, marking an 18% to 21% increase on a quarterly basis and indicating optimism regarding demand prospects. Despite supply challenges, global primary aluminium output in April rose by 3.3% year-on-year to 5.898 million tonnes, as reported by the International Aluminium Institute (IAI). China's unwrought aluminium and product imports surged by 72.1% year-on-year to 380,000 metric tons in April, with imports for the first four months of the year totaling 1.49 million tons, up 86.6% from the same period last year. Additionally, Russian aluminium imports totaled 392,775 tons in the first quarter, marking a significant increase of 127.7% compared to the corresponding period last year. From a technical perspective, the aluminium market witnessed short covering, with a -5.01% drop in open interest to 3,204 contracts, coupled with a price increase of 0.3 rupees. Support for aluminium is identified at 238.9, with the potential for a test of 236.7 levels below this support. Resistance is expected at 243.2, with prices potentially testing 245.3 upon surpassing this level.
Trading Ideas:
* Aluminium trading range for the day is 236.7-245.3.
* Aluminium settled flat amid concerns that high interest rates are curbing metals demand.
* A continued inflow of "wider money" into metals, providing further support for aluminium.
* Shortages of alumina, emerged recently because of lower output from China and disruption to Rio Tinto's Australian exports.
Cotton candy
Cotton candy prices dipped by 1.05% to settle at 56,480, primarily due to concerns over sluggish milling demand amid muted global yarn demand. However, the downside was limited by robust demand for Indian cotton from countries like Bangladesh and Vietnam. Additionally, prospects of a better crop in countries such as Australia and projected increases in cotton-producing areas, production, consumption, and trade for the next season by the International Cotton Advisory Committee (ICAC) provided some support to the market sentiment. India's cotton stocks are anticipated to decline by nearly 31% in 2023/24, reaching their lowest level in more than three decades, driven by lower production and rising consumption. This decline in stockpiles is expected to limit exports from India, the world's second-biggest cotton producer, supporting global prices while potentially lifting domestic prices and impacting the margins of local textile companies. Looking ahead to the marketing year 2024/25, India's cotton production is estimated to decrease by two percent to 25.4 million 480 lb. bales, with mill consumption expected to rise by two percent. China's cotton imports are forecasted to increase to 2.4 million metric tons, driven by higher demand for textile and apparel products both domestically and internationally. Technically, the cotton candy market is undergoing long liquidation, with a 0.82% drop in open interest to settle at 361 contracts as prices declined by 600 rupees. Support is identified at 56,280, with potential testing of 56,090 if prices continue to decrease. Resistance is likely at 56,680, and a move above this level could see prices testing 56,890. Traders are closely monitoring demand dynamics, production forecasts, and global market trends for further insights into cotton candy price movements.
Trading Ideas:
* Cottoncandy trading range for the day is 56090-56890.
* Cotton dropped as sluggish milling demand is still concerns amid muted demand of yarn.
* U.S. ending stocks projected 1.3 million bales above 2023/24 level
* Global supplies in 2024/25 projected to be higher than previous year
* In Rajkot, a major spot market, the price ended at 26808.95 Rupees dropped by -0.14 percent.
Turmeric
Turmeric prices saw a significant decline of -2.51%, settling at 16804, amidst an increase in supplies marking the end of the harvesting season. Despite this downturn, the downside was limited as farmers held back stocks in anticipation of further price rises. However, the prevailing heatwave across India threatens to damage crop yields, exacerbating the supply crunch and potentially supporting prices. The India Meteorological Department's forecast suggests that most parts of the country are likely to experience more heatwave days than usual in May, with significantly reduced rainfall over southern regions in April further adding to concerns. According to the Ministry of Agriculture and Farmers’ Welfare, turmeric production for 2023-24 is estimated at 10.74 lakh tonnes, a decrease from the previous year's production of 11.30 lakh tonnes. Turmeric exports during Apr-Mar 2024 dropped by 4.75% compared to the previous year, while imports decreased by 12.71% during the same period. In March 2024, turmeric exports witnessed a significant rise compared to February 2024, but a decline compared to March 2023, indicating fluctuating export trends. In the major spot market of Nizamabad, turmeric prices ended lower at 17980.15 Rupees, marking a -0.75% decrease. From a technical standpoint, the turmeric market observed long liquidation, with a -6.85% drop in open interest to 10745 contracts, accompanied by a price decrease of -432 rupees. Support for turmeric is identified at 16452, with the potential for a test of 16098 levels below this support. Resistance is expected at 17256, with prices potentially testing 17706 upon surpassing this level.
Trading Ideas:
* Turmeric trading range for the day is 16098-17706.
* Turmeric dropped amid increase in supplies at the end of harvesting season.
* The current heat wave could severely damage the crop yield, further contributing to the supply crunch.
* The Ministry of Agriculture first advance estimate for turmeric production in 2023-24 is estimated at 10.74 lakh tonnes
* In Nizamabad, a major spot market, the price ended at 17980.15 Rupees dropped by -0.75 percent.
Jeera
Jeera prices experienced a slight decline of 0.63% to settle at 28,420 amid expectations of higher production, which could potentially weigh on prices. This season, jeera production is forecasted to be 30% higher at 8.5-9 lakh tonnes due to a substantial rise in cultivation area, particularly in Gujarat and Rajasthan. Globally, significant increases in cumin production, particularly in China, Syria, Turkey, and Afghanistan, are expected to contribute to a surplus in supplies, leading to downward pressure on prices. Despite the anticipation of higher production, downside was limited by robust domestic and export demand alongside tight global supplies. Farmers withholding stocks in anticipation of better prices further supported prices. Notably, Gujarat is estimated to produce a record 4.08 lakh tonnes of cumin, while Rajasthan's production also increased significantly. However, the decline in jeera exports during April-March 2024 by 13.53% compared to the previous year, coupled with a rise in exports in March 2024, indicates some volatility in trade dynamics. India's average annual cumin export, although typically around 0.2 million tonnes, saw a decline in 2023, which is expected to rebound in 2024 due to increased sowing areas and declining international prices. Technically, the jeera market is undergoing long liquidation, with a 0.26% drop in open interest to settle at 2,304 contracts as prices decreased by 180 rupees. Support is identified at 28,070, with potential testing of 27,710 if prices continue to decline. Resistance is likely at 28,870, and a move above this level could see prices testing 29,310. Traders are closely monitoring production forecasts, export trends, and global market dynamics for further insights into jeera price movements.
Trading Ideas:
* Jeera trading range for the day is 27710-29310.
* Jeera dropped as the expectation of higher production could weigh on the prices.
* China's cumin output soared to over 55-60 thousand tons from the previous 28-30 thousand tons.
* Turkey anticipates producing 12-15 thousand tons, while Afghanistan's output could double.
* In Unjha, a major spot market, the price ended at 28687.15 Rupees gained by 0.19 percent.
Views express by all participants are for information & academic purpose only. Kindly read disclaimer before referring below views.