Crudeoil trading range for the day is 6620-7040 - Kedia Advisory

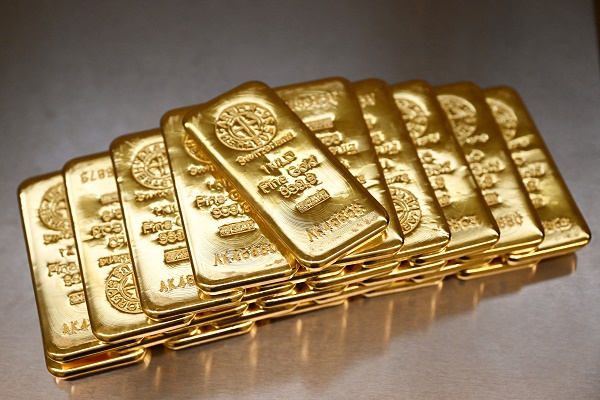
Gold
Gold prices rose by 0.21% to settle at 60,911 as concerns about the U.S. labor market losing momentum surfaced. The U.S. Labor Department reported a higher-than-expected increase in weekly jobless claims, with 217,000 claims filed, up 5,000 from the previous week. The Federal Reserve decided to keep interest rates unchanged without providing clear guidance on future monetary policy. However, gold's near-record highs may dampen demand in India during the festival season, potentially resulting in the lowest purchase volumes in three years. This is significant as India is the world's second-largest gold consumer. A drop in purchases could limit the global price rally and help narrow India's trade deficit, supporting the rupee. Additionally, global gold demand trading decreased by 6% in the third quarter due to a decline in central bank buying and reduced consumption by jewelers, as reported by the World Gold Council (WGC). From a technical perspective, the market saw short covering, with a decrease in open interest by -0.48% to 14,018, while prices increased by 126 rupees. Gold has support at 60,760 and may test 60,610 levels if it falls below. On the upside, resistance is expected at 61,050, with potential for prices to test 61,190.
Trading Ideas:
* Gold trading range for the day is 60610-61190.
* Gold gains as U.S. labor market appears to be losing some momentum.
* The number of American workers applying for first-time unemployment benefits rises more than expected.
* Federal Reserve leaves interest rates unchanged and provides little forward guidance on its monetary policy.
SILVER
Silver prices showed a slight gain, rising by 0.14% to close at 71,400. This increase was primarily driven by a significant decline in the value of the US dollar and Treasury yields. The US Federal Reserve decided to keep interest rates unchanged for the second consecutive time and indicated a pause in rate hikes. Economic data also indicated a weakening US labor market, with initial jobless claims exceeding expectations for the second consecutive week. In Europe, the Bank of England (BoE) extended its rate pause for a second meeting, but emphasized that rates would need to remain elevated for an extended period. Geopolitical tensions in the Middle East, particularly the Israeli strike on a Hamas commander in Gaza, contributed to support for the precious metal. On the economic front, new orders for manufactured goods in the US saw a significant increase of 2.8% in September 2023, surpassing market expectations. However, the number of Americans filing for unemployment benefits rose by 5,000 to 217,000, exceeding market expectations and marking the highest number of claims in nearly two months. Continuing claims also increased, suggesting challenges in finding employment for the unemployed. From a technical perspective, the silver market witnessed fresh buying, with a 2.33% increase in open interest, closing at 20,472. Silver prices gained 102 rupees. Support for silver is seen at 70,945, with a potential test of 70,495. Resistance is expected at 72,015, and a move above this level could lead to prices testing 72,635.
Trading Ideas:
* Silver trading range for the day is 70495-72635.
* Silver gains benefiting mainly from sharp falls in the dollar and Treasury yields.
* Those moves came as the US Federal Reserve held interest rates steady for the second time and hinted at the end of hikes.
* The latest economic data pointed to softening in the US labour market, with the intial jobless claims beating expectations for the second week.
CRUDE OIL
Crude oil prices rose by 1.92% to 68.92 yesterday, driven by renewed risk appetite in financial markets following the U.S. Federal Reserve's decision to maintain benchmark interest rates. The U.S. Energy Information Administration (EIA) reported a smaller-than-expected increase in crude inventory, with a rise of 0.774 million barrels instead of the anticipated 1.3 million barrels. Gasoline stockpiles unexpectedly grew by 0.1 million barrels, and distillate stockpiles decreased by 0.8 million barrels, contrary to expectations of a 1.5-million-barrel drop. OPEC oil output increased for the third consecutive month in October, primarily due to higher production in Nigeria and Angola, despite ongoing production cuts by Saudi Arabia and other OPEC+ members. OPEC produced 27.90 million barrels per day, up by 180,000 bpd from September, driven by improved exports from Nigeria, increased shipments from Angola, and Iran's continued supply growth despite U.S. sanctions. From a technical perspective, there was short covering in the market as open interest dropped by -17.94% to 5980, while prices increased by 130 rupees. Crude oil has support at 6756, with a potential test of 6620. Resistance is likely at 6966, and a move above it could lead to a test of 7040.
Trading Ideas:
* Crudeoil trading range for the day is 6620-7040.
* Crude oil gained as risk appetite returned to financial markets after the U.S. Federal Reserve kept benchmark interest rates on hold.
* Crude inventory in the U.S. rose by 0.774 million barrels, less than an expected increase of 1.3 million barrels.
* OPEC oil output has risen for a third straight month in October
NATURAL GAS
Natural gas prices faced a decline of -0.96% yesterday, settling at 288.6 due to increased output and milder weather forecasts, which lowered heating demand expectations for the coming week. Despite a surge in the flow of gas to U.S. liquefied natural gas (LNG) export facilities, prices dropped. This drop is linked to the substantial increase in U.S. gas production, which was a delayed response to high prices in 2022. However, the subsequent price slump has led to a more pronounced slowdown in output growth. In August 2023, dry gas production rose by just 3% compared to the same month in the previous year, marking a significant deceleration from the nearly 7% growth seen a year ago. Low futures prices have forced the industry to adapt to a challenging environment. The number of rigs drilling primarily for gas has decreased to 118 in October 2023, down from a peak of 162 in September 2022. As of November, gas output in the Lower 48 U.S. states increased to 106.1 billion cubic feet per day, following a record high of 104.2 bcfd in October. Meteorologists are anticipating a shift from colder-than-normal weather to mostly warmer conditions from November 4-17. From a technical perspective, the market is experiencing fresh selling pressure, with open interest rising by 11.95% to settle at 15052. Prices have dropped by -2.8 rupees. Key support levels are at 284.6 and 280.5, while resistance is expected around 292.1, with potential testing of 295.5 if surpassed.
Trading Ideas:
* Naturalgas trading range for the day is 280.5-295.5.
* Natural gas slid on record output and forecasts for milder weather and lower heating demand.
* That price decline came even though the amount of gas flowing to U.S. liquefied natural gas (LNG) export plants rose to a near-record high.
* U.S. gas output has continued to increase, a lagged response to high prices in 2022
COPPER
Copper marked a 0.54% increase, settling at 710.4, buoyed by optimistic demand forecasts and concerns over supply constraints. Beijing's decision to expand its budget by an additional CNY 1 trillion for manufacturing investments strengthened industrial input purchases, mitigating worries about reduced demand stemming from the beleaguered residential construction sector. The Federal Reserve's indication of halting further rate hikes exerted pressure on the dollar, augmenting interest in industrial resources. Yet, supply concerns emerged with sharp declines in copper stocks at the Shanghai Futures Exchange and the London Metal Exchange, compounded by production downgrades from major mining companies due to operational issues in South American mines. China's manufacturing data falling short of expectations further dampened the demand outlook for copper. Although Chile's copper output rose by 4.1% year-on-year in September, the overall refined copper market recorded a deficit of 33,000 metric tons in August, in contrast to a 30,000 metric tons deficit in July. Technically, the market indicated short covering, evident through a 4.27% drop in open interest settling at 6461, alongside a price increase of 3.8 rupees. The support for Copper rests at 708.2; a breach below this level might test 706.1. Conversely, resistance is anticipated at 712.2, and breaching this level could potentially drive prices toward 714.1.
Trading Ideas:
* Copper trading range for the day is 706.1-714.1.
* Copper rose on forecasts of robust demand and concerns about low supply.
* The global refined copper market showed a 33,000 metric tons deficit in August
* Beijing stated it would widen its budget for the year to borrow an extra CNY 1 trillion for manufacturing investments, raising buying activity for industrial inputs
ZINC
The zinc market experienced a slight decline, settling at 221.75, with a -0.2% change attributed to profit booking. This fall was triggered by Nyrstar's announcement regarding the temporary closure of two zinc mines in Tennessee, USA, due to weak prices and inflation's impact. Such actions contributed to a slight sense of oversupply in the global refined zinc market, a shift from the anticipated deficit. The adjustment in demand projections, particularly in China, where manufacturing and non-manufacturing PMI figures reflected a fragile economy, influenced this alteration. The revised outlook by the International Lead and Zinc Study Group estimated a surplus of 248,000 metric tons for 2023, as opposed to the earlier forecasted deficit of 45,000 tons. The global demand for refined zinc, now pegged at 13.59 million tons, exhibited a modest 1.1% increase, contrasting the initial 13.80 million tons projection in April. China, a pivotal player in zinc production, demonstrated a month-on-month growth in refined zinc output, though falling slightly below expectations, registering 544,000 metric tons in September 2023. The cumulative refined zinc output in the first nine months of the year showcased a steady year-on-year increase of 9.84%. Technically, the market witnessed a long liquidation phase with a decline in open interest by -7.73%, settling at 3629, while prices dropped by -0.45 rupees. The support level for Zinc stands at 220.5; a breach below this might lead to a test of 219.3 levels. Conversely, resistance is anticipated at 223.9, and surpassing this level could signal a price test at 226.1.
Trading Ideas:
* Zinc trading range for the day is 219.3-226.1.
* Zinc dropped on profit booking after prices rose as Nyrstar plans to temporarily close two zinc mines.
* Global zinc market surplus widens in August – ILZSG
* The global zinc market to show a surplus of 148,000 metric tons this year and 238,000 tons in 2024.
ALUMINIUM
Aluminium prices experienced a slight dip by -0.22%, settling at 205.8, mainly due to profit booking following a recent rise. The decline followed the announcement of capacity cuts by Chinese aluminium smelters in Yunnan province, reducing around 1.15 million metric tons of capacity to comply with government-mandated curbs until April. This step aimed to address water shortages affecting output in the region, impacting about 12% of China's total aluminium capacity. Global aluminium production has increased as European smelters resumed operations due to stabilized power prices and China's Yunnan province relaxed hydro power restrictions. This rise in production, coupled with subdued demand from weakened economic activities, particularly in Europe, has shifted analysts' expectations from deficits to surpluses. Forecasts indicate an expected surplus of 338,000 tons in 2023 and 250,000 tons in 2024, contrasting with previous deficit predictions. Technically, the aluminium market has observed fresh selling with a 4.37% increase in open interest, settling at 3,152. The current support stands at 205, with a potential test at 204.2, while resistance is likely at 206.8, with the possibility of prices testing 207.8.
Trading Ideas:
* Aluminium trading range for the day is 204.2-207.8.
* Aluminum dropped on profit booking after China's Yunnan smelters cut production
* Global aluminium production has ramped up this year as smelters come back on line in Europe
* Market surpluses of 338,000 tons this year and 250,000 tons in 2024, an about-face from deficits 191,750 tons
COTTON
Cotton prices rose by 0.48% to 58620 due to expectations of a 7.5% decrease in India's cotton production for 2023/24. Lower planting and El Nino weather are impacting productivity. Import projections for India indicate an increase to 2.2 million bales in the current marketing year, up from 1.25 million bales in the previous year, according to the Cotton Association of India (CAI). The USDA's October report suggests reduced cotton production in the U.S. due to lower yields in Texas. Brazil is expected to surpass the U.S. in cotton production for the first time, and Australia's cotton exports to China have surged due to improving trade relations. The CAI's final estimate for the 2022-23 cotton crop in India is 31.8 million bales, slightly higher than their earlier estimate, but lower than the government's estimate. For the 2023-24 season, India anticipates producing 330-340 lakh bales. In the Rajkot spot market, cotton prices closed at 27278.1 Rupees with a 0.1% gain. From a technical perspective, the market experienced short covering with a drop in open interest by 1.87% and a price increase of 280 rupees. Support for Cottoncandy is around 58080, with the potential to test 57540 levels below, while resistance is expected at 59080, with a chance to reach 59540 on an upward price move.
Trading Ideas:
* Cottoncandy trading range for the day is 57540-59540.
* Cotton gains as India's cotton production in 2023/24 is likely to fall 7.5%.
* Imports could rise to 2.2 million bales in the marketing year that started on Oct. 1, up from the last year's 1.25 million bales
* USDA cut U.S. production in 2023/24 to 12.8 million bales
* In Rajkot, a major spot market, the price ended at 27278.1 Rupees gained by 0.1 percent.
TURMERIC
Turmeric prices fell by 2.95% to 13620 due to favorable weather conditions improving crop outlook, but limited downside is expected because of potential yield losses in October. Despite current satisfactory crop conditions, drier October weather may impact the harvest. Price stability is maintained due to buying activity and decreasing supplies, with support from increased export opportunities driven by rising global demand. Turmeric exports grew by 25%, but expectations of a 20-25% decline in seeding, especially in states like Maharashtra, Tamil Nadu, Andhra Pradesh, and Telangana, reflect shifting farmer priorities. Export data reveals a rise of 11.51% in turmeric exports from April to August 2023 compared to the same period in 2022. However, August 2023 saw an 18.20% decline compared to July, and a 6.67% decrease year-on-year. The IMD's forecast indicates that below-average October rainfall may affect crop growth. In Nizamabad, a major spot market, turmeric prices closed at 13657.85 Rupees, showing a 0.44% gain. From a technical perspective, the market experienced long liquidation with a drop in open interest by 0.11% to settle at 13240, while prices decreased by 414 rupees. Turmeric has support at 13384 and could test 13150 levels below, with resistance anticipated at 13996, potentially reaching 14374 with an upward price move.
Trading Ideas:
* Turmeric trading range for the day is 13150-14374.
* Turmeric dropped amid improved crop condition due to favorable weather condition.
* However, downside seen limited due to the potential for yield losses caused.
* Expectations for a 20–25 percent decline in turmeric seeding this year
* In Nizamabad, a major spot market, the price ended at 13657.85 Rupees gained by 0.44 percent.
JEERA
Jeera faced a significant 6% decline, settling at 40515 due to favorable weather conditions encouraging robust sowing activities, triggering concerns over abundant supply. Recent price drops attracted stockists to buy, prompting short covering. Limited high-quality crop availability also supported prices. However, global demand for Indian jeera waned as buyers favored alternative origins like Syria and Turkey due to India's higher prices, keeping export activities subdued. Indian jeera remained competitively priced in the global market but unfavorably impacted exporters, leading to an expected decline in export activities. Uncertainty arises with China's possible purchase of Indian cumin in October-November before new arrivals. Data shows a decrease in jeera exports from April to August 2023 by 23.76% compared to the same period in 2022. While August 2023 saw a slight drop compared to July, the year-on-year export figures show a significant decline. Weather predictions indicate normal rainfall, supporting favorable sowing conditions. In the major spot market of Unjha, Jeera prices closed at 42828.4 Rupees, experiencing a 0.77% decrease. From a technical standpoint, the market observed long liquidation with a drop in open interest by 2.17% to settle at 3513, paired with a substantial price decrease of 2585 rupees. Support for Jeera is estimated at 39970 with potential further decline to 39400, while resistance is anticipated at 41650, possibly testing 42760 with an upward price move.
Trading Ideas:
* Jeera trading range for the day is 39400-42760.
* Jeera dropped as adequate soil moisture, and favorable weather condition for crop will boost the overall sowing activities.
* The upcoming sowing of jeera that is expected to remain normal due to favorable weather condition.
* Stockists are showing interest in buying on recent downfall in prices triggering short covering.
* In Unjha, a major spot market, the price ended at 42828.4 Rupees dropped by -0.77 percent.
Views express by all participants are for information & academic purpose only. Kindly read disclaimer before referring below views. Click Here For Disclaimer