Commodity inflows plunged Rs.45,708 Cr in Feb despite leading 80% 1Y return : Vallum Capital

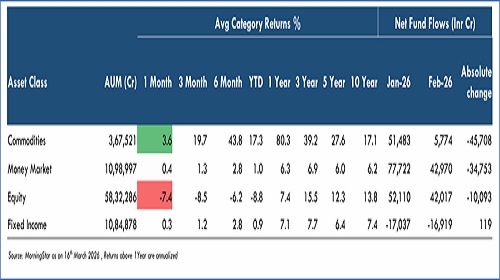
Commodities: Net fund flows declined from Rs51,483 Cr in January to Rs5,774 Cr in February, a sharp drop of Rs45,708 Cr (~-89%).
Money Market: Net fund flows fell from Rs77,722 Cr in January to Rs42,970 Cr in February, down Rs34,753 Cr (~-45%).
Equity: Net fund flows moderated from Rs52,110 Cr in January to Rs42,017 Cr in February, a decline of Rs10,093 Cr (~-19%).
Fixed Income: Net outflows narrowed slightly from -Rs17,037 Cr in January to -Rs16,919 Cr in February, improving by Rs119 Cr (~+1%).
According to Vallum Capital’s Monthly Macro Grid Chartbook report, total net asset-level flows nearly halved from Rs1,64,277 Cr in January to Rs73,842 Cr in February (-55%). Commodity flows collapsed as gold mania faded, while the money market cooled sharply. Fixed income continued steady outflows, whereas equity flows held relatively firm.
Commodities (Rs5,774 Cr, -89%)
Precious Metals cratered to Rs5,774 Cr from Rs51,483 Cr as gold correction as well as silver saw sharp dip in February after January's surge. Sharpest single-month flow reversal across all asset classes. Retail investors lost interest as momentum faded away in gold and silver.
Money Market (Rs42,970 Cr, -45%)
India Money Market normalized to Rs42,970 Cr from Rs77,722 Cr after January's quarter-end driven spike. February still represents elevated institutional cash preference.
Equity (Rs42,017 Cr, -19%)
- Broad market equity funds moderated to Rs27,254 Cr from Rs30,359 Cr. Large-Cap eased to Rs9,316 Cr from Rs11,007 Cr but remained dominant. Notably, Mid-Cap and Small-Cap moved against the trend — Mid-Cap rose to Rs3,739 Cr from Rs3,297 Cr and Small-Cap to Rs3,055 Cr from Rs2,536 Cr, signaling dip-buying in beaten-down segments. Flexi Cap slowed to Rs6,046 Cr from Rs8,100 Cr.
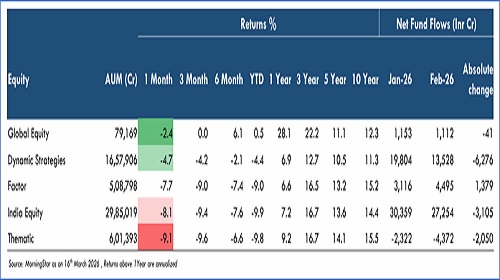
Broad-based domestic equity correction in the near term (1M: avg -7.4%), fund flows turned cautious as Dynamic Strategies and India Equity saw Rs6,276 Cr and Rs3,105 Cr outflows in Feb-26.
- Global Equity flow saw no major change at inflow of Rs1,112 Cr.
- Dynamic Strategies slowed to Rs13,528 Cr from Rs19,804 Cr. Multi-Asset Allocation remained the anchor at Rs9,060 Cr. Arbitrage dipped to Rs535 Cr from Rs5,075 Cr — the sharpest monthly Inflows equity drop.
- Factor Funds accelerated to Rs4,495 Cr from Rs3,116 Cr, led by Quality at Rs2,261 Cr (from Rs125 Cr) on the back of a new NFO launch absorbing over half the category.
- Thematic outflows deepened to -Rs4,372 Cr from -Rs2,322 Cr. PSU Fund category saw large outflows at -Rs5,389 Cr from -Rs3,859 Cr. On the flip side, Technology was the biggest contrarian winner, flipping to +Rs1,541 Cr from -Rs210 Cr despite a weak -11.1% monthly return. BFSI also turned positive at Rs828 Cr from -Rs205 Cr.
Fixed Income (-Rs16,919 Cr, +1%)
India Fixed Income worsened to -Rs16,919 Cr from -Rs17,037 Cr. Government Bonds were the bright spot, improving to -Rs346 Cr from -Rs1,850 Cr. Core outflow remains entrenched.
February shows January extremes mean-reverting — gold mania cooling, money market normalizing, dip-buying emerging in mid/small caps & tech — while fixed income outflows remain entrenched.
Above views are of the author and not of the website kindly read disclaimer