

CareEdge Markets Roundup: Macro Trends and Market Outlook by CareEdge Ratings

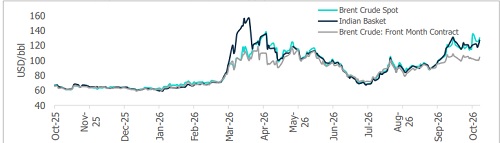
West Asia Conflict Escalates, Keeping Oil Prices High: The conflict in West Asia has intensified over the past two weeks. Yemen’s Houthi rebels have increased attacks on Saudi oil facilities and airports, including Riyadh’s main airport. A missile strike on Saudi Aramco’s Dhahran complex reportedly caused a fire, following earlier attacks on the company’s Jazan refinery in July and the East-West pipeline in September, which carries crude to the Red Sea port of Yanbu. Meanwhile, Iran has targeted tankers in and near the Strait of Hormuz, although the US says more vessels are now transiting under its protection. Brent crude has consequently remained above USD 100/bbl, trading between USD 100-108/bbl over the past two weeks. Spot prices have risen further, with spot Brent reaching about USD 135/bbl in early October, signalling very tight supply. OPEC+ kept its November output targets unchanged, while Gulf producers continue to pump well below their quotas. However, President Trump’s announcement of a Russia-Ukraine ‘energy ceasefire’ – despite no confirmation from either side – has recently calmed the market to some extent.
The following factors are currently having an impact on the oil market:
• Widening Gap Between the Indian Basket, Spot Oil Prices, and Brent Futures: Both India’s crude basket and Spot Brent Crude prices are trading well above Brent Crude futures. Indian basket and Spot Brent Crude prices averaged about USD 123/bbl and USD 126/bbl to date in October, much higher than the Brent front-month futures contract, which averaged USD 1s03/bbl (Exhibit 1). This divergence between spot prices and futures prices reflects scarce physical supply of crude oil. Higher geopolitical tensions and attacks on shipping lanes also raise shipping and insurance costs, pushing up onshore prices even more.
• Widening crack spreads: Fuel prices are rising faster than crude prices, pushing refining margins to record levels. The US diesel crack spread is around USD 70/bbl, much higher than USD 20-25/bbl during normal times. Attacks on Russian and Gulf refineries have reduced capacity, while fuel stocks remain low. This keeps diesel and jet fuel prices high, with prices rising faster than Brent crude.
• Expected uptick in demand in coming months: Oil demand usually rises in winter as more fuel is used for heating, especially in Europe and North America. Countries will also need to refill stocks used up during the conflict, and China is buying more crude oil again. OPEC has cut its 2026 demand forecast for the sixth time in a row but raised its 2027 forecast because of this restocking. These factors could add upward pressure on energy prices in the coming month.
Exhibit 1: Widening Spreads Indicating Tighter Supply
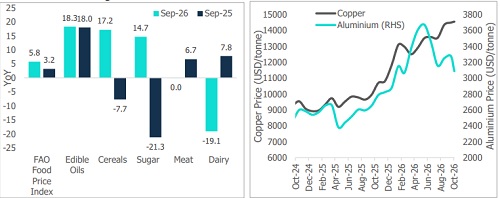
Global Food and Industrial Metal Prices Add to Inflationary Pressures Beyond Energy: Industrial metal price movements over the past month have largely been driven by commodity-specific demand and supply dynamics. Copper prices surged to a record high amid concerns over declining inventories and supply disruptions, while robust demand from electrification, renewable energy expansion and data centres has provided further support (Exhibit 3). Aluminium prices have eased from their May highs amid some de-escalation of the conflict in West Asia. However, prices remain elevated compared with year-ago levels. The risk of a rebound in aluminium prices remains high, given the volatile geopolitical situation in West Asia.
Global food inflation has also increased, driven by higher prices of sugar, edible oils and foodgrains (Exhibit 2). El Niño-induced below-normal rainfall in Southeast Asia has affected edible oil production, particularly palm oil. Ongoing logistical disruptions in the Black Sea region amid the Russia–Ukraine conflict have further added to price pressures in both edible oil and cereals. Disruptions along key maritime chokepoints, combined with adverse weather conditions, have pushed up cereal prices, particularly rice. Higher fertiliser prices have also contributed to elevated food production costs. Meanwhile, lower sugarcane production in Thailand and concerns over crop prospects in India amid below-normal rainfall have supported global sugar prices. The diversion of foodgrains towards biofuel production, amid elevated global energy prices, has added to these pressures. Elevated commodity prices are a concern, as they could indirectly feed into consumer price inflation globally.
Exhibit 2: Edible Oil, Cereals, and Sugar Drive Global Food Prices Higher Exhibit 3: Industrial Metal Prices Also Remain Elevated
Rising Global Sovereign Yields and Rate Hike Expectations
Global bond markets over the past year have remained under pressure from concerns over fiscal sustainability and inflation, reflected in elevated long-term yields and higher term premia. Persistent fiscal pressures and inflation continue to pose upside risks to long-end yields across major advanced economies. However, yields have eased considerably over the past couple of weeks, although they remain high by historical standards. The recent moderation in yields follows a sharp sell-off in long-dated government bonds, which had pushed yields to multidecade highs. At these elevated levels, government bonds have become more attractive to investors, prompting a shift towards safer assets amid growing concerns that rising borrowing costs could constrain economic growth and increase financing pressures for debt-intensive sectors, particularly AI infrastructure. This reallocation towards government bonds has supported prices and contributed to the recent decline in yields.
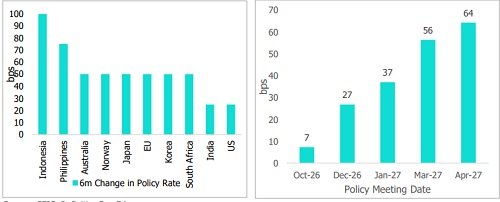
Inflation remains above central bank targets across most major economies, reinforcing market expectations of further monetary tightening in the coming months (Exhibit 4). In the US, although the Federal Reserve is expected to keep rates unchanged at its upcoming policy meeting in October, ahead of the midterm elections, markets are pricing in a resumption of rate hikes thereafter. The Overnight Index Swap (OIS) curve indicates expectations of two additional 25-bps rate hikes by the US Federal Reserve in December 2026 and March 2027 (Exhibit 5). Similarly, euro short-term rate (ESTR) forwards imply two 25-bps rate hikes by the European Central Bank over the same period, suggesting that markets anticipate a continued tightening cycle across both economies.
Exhibit 4: Policy Rate Hikes by Major Central Banks over the past 6 months Exhibit 5: US FED-OIS Implied Policy Rate Change
Domestic Liquidity Surplus Narrows but Yields Remain Elevated
To tackle the glut in systemic liquidity resulting from the strong FCNR inflows, the Reserve Bank of India (RBI) successfully conducted an Open Market Operation (OMO) sale of government securities worth Rs 250 billion on 13th October 2026. This follows earlier OMO sales in September 2026, through which the RBI absorbed Rs 1 trillion in three tranches (Exhibit 7). The RBI has shifted its forward guidance to an explicitly hawkish bias, moving its policy stance to "calibrated tightening" with a 25-bps rate hike. While the central bank does not provide a fixed, pre-announced calendar for OMOs, its recent policy actions indicate that future liquidity management will rely on active, opportunistic OMO sales to align system liquidity with its restrictive policy stance. Apart from the RBI’s interventions, part of the excess liquidity should be absorbed by the festive-season uptick in currency demand, the maturity of the RBI’s short dollar forward positions, and higher CRR requirements linked to deposit growth. Tighter liquidity conditions are crucial for effective transmission of the rate hike undertaken by the RBI. Policy rate hikes, OMO sales and inflationary concerns have pushed up the yield curve across tenors (Exhibit 6).
Banking system liquidity has moderated to 0.9% of Net Demand and Time Liabilities (NDTL) as of October 15, 2026 (Exhibit 8), bringing it closer to the average of 0.8% recorded during May 2025–May 2026, before the FCNR-related inflows. Liquidity conditions are likely to tighten further following the RBI’s decision to increase the minimum daily CRR maintenance requirement from 90% to 99% of the prescribed requirement, effective from the reporting fortnight commencing October 16, 2026. The narrower compliance band will constrain banks’ ability to utilise a larger share of their funds for short-term market deployment during the fortnight, facilitating the absorption of surplus liquidity. The recent tightening has already driven up the weighted average call money rate, signalling firmer overnight money-market conditions (Exhibit 9). This should help improve liquidity management and limit the need for additional large-scale absorption measures. Against this backdrop, we expect the ongoing rate-hiking cycle to remain relatively shallow, with a further cumulative increase of 50 bps over the next few policy meetings..
Above views are of the author and not of the website kindly read disclaimer