Bulls and Bears : Gathering momentum; FIIs clock inflows for the second consecutive month by Motilal Oswal Financial Services Ltd
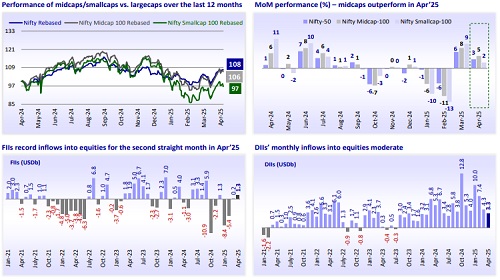
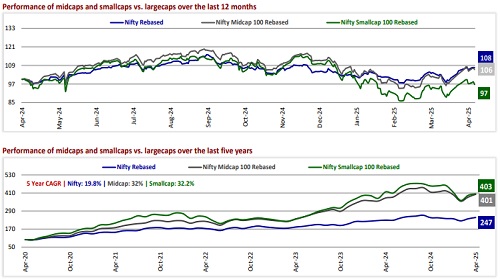
* Nifty sustains its winning streak: The Nifty rose for the second successive month in Apr’25 (3.5% MoM gain), recording the second-best MoM returns in the last nine months. Notably, the index remained volatile, fluctuating around 2,714 points before closing 815 points higher. The Nifty has risen 2.9% in CY25YTD. The Nifty Midcap 100 (+4.7% MoM) outperformed the Nifty-50 and Nifty Smallcap 100 (+2.2%) during the month. Over the last 12 months, largecaps have gained 8%, outperforming midcaps (+6%) and smallcaps (-3%), respectively. During the last five years, midcaps (CAGR: 32%) have notably outperformed largecaps (CAGR: 19.8%) by 154%, while smallcaps (CAGR: 32.2%) have outpaced largecaps by 156%.
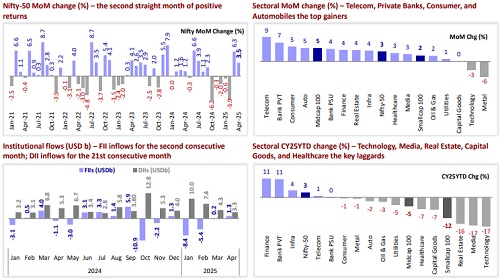
* FIIs record inflows for the second consecutive month: FIIs were net buyers for the second consecutive month, investing USD1.3b in Apr’25. DIIs also showed healthy inflows, amounting to USD3.3b in Apr’25. FII outflows into Indian equities have reached USD12.3b in CY25YTD vs. outflows of USD0.8b in CY24. DII inflows into equities remain robust at USD25.1b in CY25YTD vs. USD62.9b in CY24.
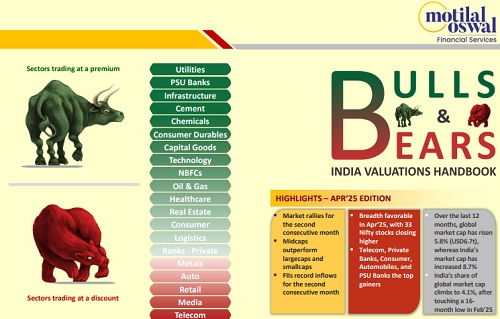
* All major sectors end higher in Apr’25: Among the sectors, Telecom (+9%), Private Banks (+7%), Consumer (+5%), Automobiles (+5%), and PSU Banks (+4%) were the top gainers MoM, while Metals (-6%) and Technology (-3%) were the only laggards. The breadth was favorable in Apr’25, with 33 Nifty stocks ending higher. IndusInd Bank (+29%), Tata Consumer (+16%), Eternal (+15%), Jio Financial (+14%), and SBI Life Insurance (+14%) were the top performers, while Tata Steel (-9%), Hindalco (-8%), Wipro (-8%), Shriram Finance (-7%), and Infosys (-4%) were the key laggards.
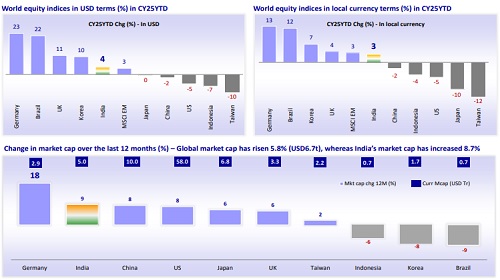
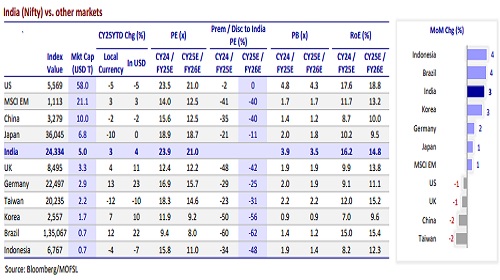
* India among the top-performing markets in Apr’25: Among the key global markets, Indonesia (+4%), Brazil (+4%), India (+3%), Korea (+3%), Germany (+2%), Japan (+1%), and MSCI EM (+1%) ended higher in local currency terms. Conversely, Taiwan (-2%), China (-2%), the UK (-2%), and the US (-1%) ended lower MoM in Apr’25. Over the last 12 months, the MSCI India Index (+4%) has underperformed the MSCI EM Index (+6%) in USD terms. Over the last 10 years, the MSCI India Index has notably outperformed the MSCI EM Index by a robust 107%. In P/E terms, the MSCI India Index is trading at a 77% premium to the MSCI EM Index, near its historical average premium of 79%. Key global markets have experienced an increase in market cap over the last 12 months; global market cap has risen 5.8% (USD6.7t), whereas India’s market cap has increased 8.7%.
* Corporate earnings in line so far in 4QFY25: The corporate earnings scorecard for 4QFY25 has been in line so far, with heavyweights driving the aggregate. The earnings spread has been decent, with 78% of our coverage universe either meeting or exceeding profit expectations. However, growth has primarily been led by the BFSI and Technology sectors. The aggregate earnings of the MOFSL Universe companies were above our estimates and increased 8% YoY (vs. our estimate of -1% YoY). Earnings of the 24 Nifty companies that have declared results so far grew 7% YoY (vs. est. of +5% YoY), led by ICICI Bank, HDFC Bank, Adani Ports, Wipro, Infosys, Bajaj Finance, and Reliance Industries.
* Our view: The market has rebounded smartly over the last two months, entirely erasing its YTD decline. The Nifty is currently trading 2.9% higher in CY25YTD. With the current rally, Nifty trades at 21x FY26E earnings, near its LPA of 20.6x. While near-term challenges such as global macros, trade wars, and a weak 4QFY25 will keep the market volatile and jittery, we believe that the medium- to long-term growth narrative for India remains intact. Our model portfolio stance remains unchanged, with a distinct bias towards largecaps and domestic plays, given the current volatile backdrop. We are OW on BFSI, IT, Industrials, Healthcare, and Telecom, while we are UW on Oil & Gas, Cement, Automobiles, Real Estate, and Metals.
* Top ideas: Largecaps – Reliance Industries, Bharti Airtel, ICICI Bank, HUL, L&T, Kotak Mahindra Bank, M&M, Titan, Trent, and TCS; Midcaps and Smallcaps – Indian Hotels, HDFC AMC, Dixon Tech, JSW Infra, BSE, Coforge, Page Industries, IPCA Labs, Suzlon and SRF.
Indian markets remain resilient and strong YTD
Midcaps outperform largecaps and smallcaps; FIIs record inflows for the second straight month
Consumer: Moderate demand; pressure on margins sustains
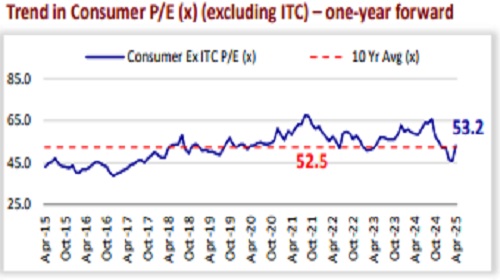
* The consumer sector is currently trading at a P/E of 45.4x, reflecting an 8% premium to its 10-year average of 42.2x. Excluding ITC, the sector’s P/E stood at 53.2x in Apr’25 (in line with its long period average), down from a peak of 67.9x in Aug’21, driven by moderating urban demand and margin pressures from elevated food and palm oil prices. Companies are taking calibrated price hikes to mitigate these cost pressures.
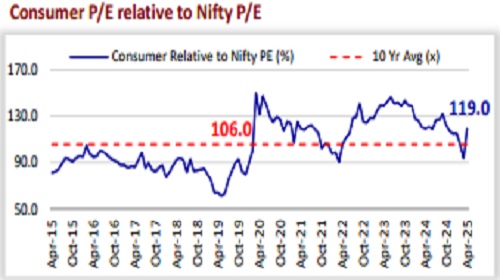
* Despite recent corrections, valuations remain above the 10-year average of 42.2x. The sector continues to command a premium over the Nifty, currently at ~119% versus the historical average of ~106%, supported by relatively stable earnings, superior RoCE, and stronger cash flows. At the onset of Covid-19 in Mar’20, the sector’s premium peaked at ~150% as investors sought defensive bets.
* Near-term demand trends remain steady across categories, although staples are likely to report muted performance due to persistent urban sluggishness and margin headwinds in categories like personal wash (e.g., grammage reductions due to high palm oil prices).
* Elevated agri-commodity costs and inadequate pricing actions are expected to weigh on gross margins. Companies are curbing A&P spending to reduce the EBITDA margin pressures.
* Alternative distribution channels such as e-commerce and modern trade are witnessing stronger growth compared to traditional trade formats. In response to evolving consumer preferences, companies are increasingly prioritizing premiumization and product innovation as key strategic pillars.
* Looking ahead, demand is expected to gradually recover, supported by a combination of favorable macroeconomic and policy factors. These include income tax relief measures announced in the Union Budget 2025, the interest rate cuts, and a moderation in food inflation. Additionally, improved agricultural output driven by healthy Rabi and Kharif crop cycles is likely to further aid consumption, particularly in rural markets.

Market rallies for the second consecutive month, up 3.5% MoM in Apr’25
* The Nifty closed higher for the second successive month in Apr’25 (3.5% MoM gain) and recorded the second-best MoM returns in the last nine months. Notably, the index continued to remain volatile and hovered around 2,714 points before closing 815 points higher. The Nifty is up 2.9% in CY25YTD.
* All major sectors ended higher – Telecom (+9%), Private Banks (+7%), Consumer (+5%), Automobiles (+5%), and PSU Banks (+4%) were the top gainers MoM, while Metals (-6%), and Technology (-3%) were the only laggards.
Breadth favorable in Apr’25; 33 Nifty companies end higher MoM
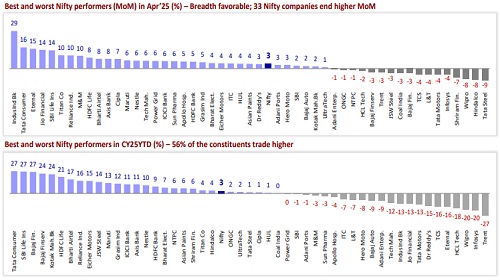
* Best and worst Nifty performers in Apr’25: IndusInd Bank (+29%), Tata Consumer (+16%), Eternal (+15%), Jio Financial (+14%), and SBI Life Insurance (+14%) were the top performers, while Tata Steel (-9%), Hindalco (-8%), Wipro (-8%), Shriram Finance (-7%), and Infosys (-4%) were the key laggards.
* Best and worst Nifty performers in CY25YTD: Tata Consumer (+27%), SBI Life Insurance(+27%), Bajaj Finance (+27%), Bajaj Finserv (+24%), and Kotak Mahindra Bank (+24%) have been the top performers, while Trent (-27%), Infosys (-20%), Wipro (-20%), HCL Tech (-18%), and Eternal (-16%) have been the key laggards.
Largecaps outperform over the last 12 months
* During the last 12 months, largecap have gained 8%, outperforming midcaps and smallcaps, which have risen 6% and -3%, respectively. During the last five years, midcaps have significantly outperformed largecaps by 154%, while smallcaps have outperformed largecaps by 156%.
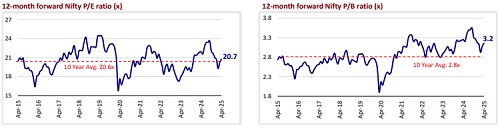
Nifty’s valuation near its historical average
* The Nifty is trading at a 12-month forward P/E ratio of 20.7x, near its LPA of 20.6x (at a 1% premium). In contrast, its P/B of 3.2x represents an 11% premium to its historical average of 2.8x.
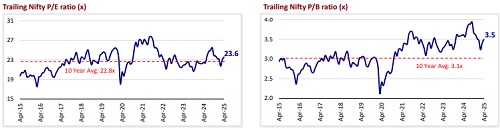
* The 12-month trailing P/E for the Nifty, at 23.6x, is above its LPA of 22.8x (at a 4% premium). At 3.5x, the 12-month trailing P/B ratio for the Nifty is above its historical average of 3.1x (at a 12% premium)
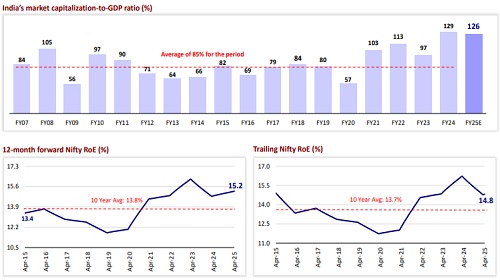
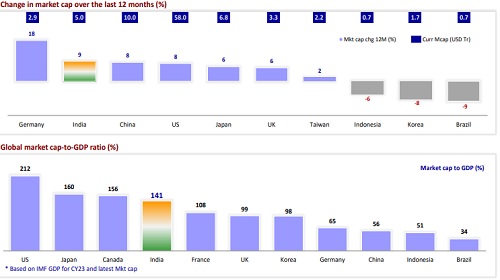
Market cap-to-GDP ratio moderates to 126%
* India’s market cap-to-GDP ratio has been volatile, plummeting to 57% (of FY20 GDP) in Mar’20 from 80% in FY19 and then sharply rebounding to 132% in FY24. It now stands at 126% of FY25E GDP (9.5% YoY), well above its long-term average of 85%.
* The Nifty is trading at a 12-month forward RoE of 15.2%, above its long-term average.
India among the top-performing markets in Apr’25
* Among the key global markets, Indonesia (+4%), Brazil (+4%), India (+3%), Korea (+3%), Germany (+2%), Japan (+1%), and MSCI EM (+1%) ended higher in local currency terms. Conversely, Taiwan (-2%), China (-2%), the UK (-2%), and the US (-1%) ended lower MoM in Apr’25.
* Indian equities have been trading at 21x FY26E earnings. The key markets continued to trade at a discount to India.
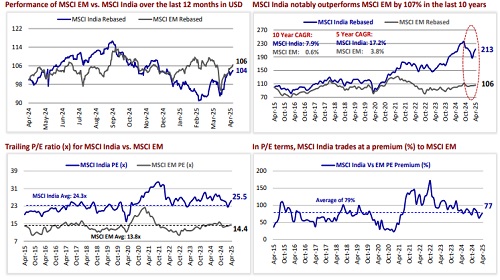
MSCI India underperforms MSCI EM over the last 12 months
* Over the last 12 months in USD terms, the MSCI India Index (+4%) has underperformed the MSCI EM Index (+6%). Over the last 10 years, the MSCI India Index has notably outperformed the MSCI EM Index by a robust 107%.
* In P/E terms, the MSCI India Index is trading at a 77% premium to the MSCI EM Index, near its historical average premium of 79%.
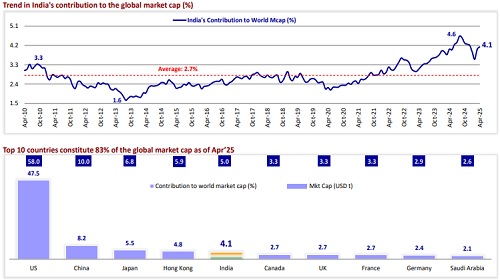
India’s share of global market cap at 4.1%, after touching a 16-month low in Feb’25
* India’s share of the global market cap stood at 4.1% in Apr’25, after touching a 16-month low of 3.6% in Feb’25.
* India is among the top 10 contributors to the global market cap. The top 10 contributors accounted for 83% of the global market cap as of Apr’25.
Key global markets experience an increase in market cap over the last 12 months
* Over the last 12 months, global market cap has risen 5.8% (USD6.7t), whereas India’s market cap has increased 8.7%.
* Barring Brazil, Korea, and Indonesia, all key global markets have witnessed a rise in market cap over the last 12 months.
For More Research Reports : Click Here
For More Motilal Oswal Securities Ltd Disclaimer
http://www.motilaloswal.com/MOSLdisclaimer/disclaimer.html
SEBI Registration number is INH000000412


More News
MOSt Market Roundup : Nifty future closed positive with gains of 0.67% at 25930 levels by Mo...