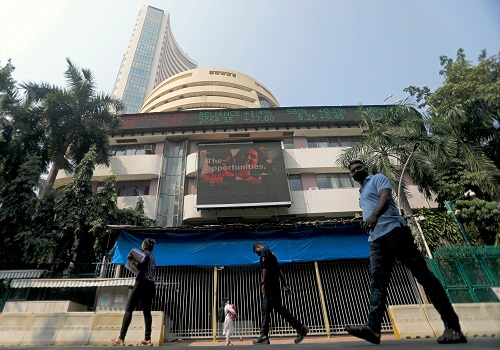
BankNifty opened with an upward gap and witnessed extreme volatility on both sides throughout the day - Axis Securities

Follow us Now on Telegram ! Get daily 10 - 12 important updates on Business, Finance and Investment. Join our Telegram Channel
Nifty
Nifty opened flat and remained within a narrow range throughout the day. On September 25th, Nifty closed at 19,675 with a minor gain of 0.3 points
On the daily chart, the index has formed a small bullish long-legged Doji candle, indicating indecisiveness among market participants regarding its direction. This Doji pattern has emerged at a critical support zone, marked by the confluence of the 61.8% Fibonacci retracement level from the rally of 19207 to 20222 at 19600, along with the 50- day Simple Moving Average (SMA) positioned at 19632.The chart pattern suggests that if Nifty manages to cross and sustain above the 19750 level, it may attract buying interest, potentially driving the index towards levels in the range of 19800 to 19900. On the downside, important support for the day is located around 19600. However, if the index sustains below this level, it might witness profit booking, potentially leading to a decline towards the 19500 to 19400 levels.Nifty is currently trading above its 50-day, 100-day, and 200-day SMAs, indicating a positive bias in the medium term. The index continues to remain in an uptrend for the medium term, making buying on dips our preferred strategy.
The daily strength indicator, Relative Strength Index (RSI), is currently moving downward and is quoting below its reference line, suggesting a negative bias in the short term.
The trend deciding level for the day is 19670. If NIFTY trades above this level then we may witness a further rally up to 19740-19805-19870 levels. However, if NIFTY trades below 19670 levels then we may see some profit booking initiating in the market, which may correct up to 19605-19535-19475 levels.
Banknifty
BankNifty opened with an upward gap and witnessed extreme volatility on both sides throughout the day. BankNifty closed at 44766 on September 25th, marking a gain of 154 points.
On the daily chart, the index has formed a small bullish candle with shadows on sides, indicating extreme volatility and indecisiveness among market participants regarding its direction. The index retested the symmetrical triangle's band near the apex of the triangle. The chart pattern suggests that if BankNifty crosses and sustains above the 44900 level, it could attract buying interest, potentially pushing the index towards levels in the range of 45000 to 45100. Important support for the day is located around 44600. However, if the index sustains below 44600, it might witness profit booking, potentially leading to a decline towards the 44500 to 44400 levels. BankNifty is sustaining above its 100-day and 200-day Simple Moving Averages (SMA), signaling bullish sentiments in the near term. BankNifty continues to remain in an uptrend in both the medium and long term, making buying on dips our preferred strategy.
The daily strength indicator, Relative Strength Index (RSI), is currently moving downward and is quoting below its reference line, indicating profit booking.
The trend-deciding level for the day is 44830. If BANK NIFTY trades above this level, then we may witness a further rally up to 45070-45515-45755 levels. However, if BANK NIFTY trades below 44830 levels, then we may see some profit booking initiating in the market, which may correct up to 44385-44145-43700 levels.
For More Axis Securities Disclaimer https://simplehai.axisdirect.in/disclaimer-home
SEBI Registration number is INZ000161633
