Bank Nifty failed to hold gains, faced extended correction after early recovery - ICICI Direct

Nifty : 24681
Technical Outlook
Day that was…
* Equity benchmarks started the week on a negative note, ending lower on the third consecutive session and settled the day at 24681, down 0.63%. Market breadth was in favor of declines, with an A/D ratio of 1:3 where broader markets underperformed the benchmark. Midcap and Small cap closed on a negative note down 0.84% and 1.26% respectively. Sectorally, Barring Pharma and FMCG all other indices closed in red, where, Realty, Metal and Nifty Private Bank underperformed.
Technical Outlook:
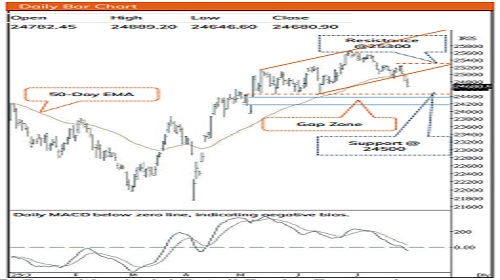
* The index opened the week with a gap down, however, it failed to capitalize the initial upmove and drifted lower making lower-high-low throughout the session. The daily price action formed a small bear candle with upper wick carrying lower high-low, indicating extended correction amid lack of clarity of U.S. bilateral trade, lackluster earning, continuous FII’s selling coupled with depreciating rupee
* Index extended losses after the breakdown of 2-months rising trend line coupled with follow through selling below 50-day EMA which has been majorly held since April. Going ahead, we expect bias to remain corrective as long as Nifty maintains lower-high-low formation. However, weekly stochastic indicator shows signs of oversold zone near 11, indicating possibility of pullback from lower levels can not be ruled out. However, to pause the on-going correction index, need to decisively close above previous session high failure to do so strong support is placed at 24500 which has been held on multiple occasions despite geopolitical worries seen during May and June which coincides with a gap (24378-24164).
* Amidst ongoing corrective phase only silver lining is that the Bank nifty is showing relative outperformance and trading within 3% of its All-Time range. Further, any positive development on earnings as well as on bilateral trade agreement would dictate the further course of action which will eventually help to retest the immediate resistance of 25300 in coming weeks.
* India VIX bounced after approaching cyclical lows of 10, we expect rise in volatility tracking U.S. Fed policy and monthly expiry.
* Structurally, over past 21 sessions index has retraced 80% of preceding 11 sessions 5% up move. The slower pace of retracement, highlights robust price structure. Hence, focus should be on accumulating quality stocks backed by strong earnings.
* Key Monitorable:
a) US Fed Policy Outcome.
b) Development on US-India bilateral trade deal.
c) Weakness in US Dollar index and Crude oil prices. d) India VIX is bouncing from extreme oversold territory.
* On the broader market front, breach of past three weeks low on Midcap and small cap indices indicates corrective bias wherein possibility of mean revision towards its short-term averages cannot be ruled out. In addition to that, the market breadth has seen deterioration as % of stocks above 50 days SMA have declined to 38% from last week’s reading of 68%
• We maintain our support base at 24500 for the Nifty which is based on 61.80% retracement of recent rally (23936-25669) coupled with 20-week EMA and gap zone (24378-24164).
Nifty Bank : 56085
Technical Outlook
Day that was...
* The Bank Nifty began the week on a weak note, closing at 56,085 down 0.79% . The Nifty Pvt Bank index underperformed benchmark, closed on a negative note, and ended at 27,148, down 1.65%
Technical Outlook:
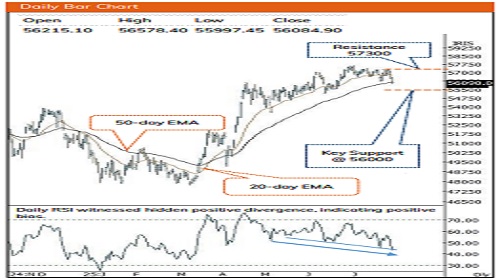
* The Bank Nifty after initial recovery in early session struggled to extend gains above the previous session low and faced extended correction. Intraday bounces remained short-lived, culminating in the formation of a bearish candle with a higher wick amid sustained selling pressure.
* Key point to highlight is that Bank nifty after a significant rally has entered a phase of price consolidation near its all-time high, marked by a period of healthy profit booking over the past three weeks. Recent price action suggests a range-bound pattern it is testing a significant horizontal resistance level around 57,300 while maintaining a supportive buying demand in the vicinity of 50-day EMA, a decisive breakout above the resistance will lead index to gradually resolve higher. Looking at the current structural development of the index heavy-weight stocks we believe index would gradually challenge it's All Time High placed around 57600 levels and eventually accelerate up move towards 58800 levels in coming quarter which is the implied target of the consolidation from (56098-53483).
* Since April, intermediate corrections have remained shallow while the index has consistently held above its 50-day EMA. Moreover, over the past three weeks, the index has retraced 50% of the preceding 4.50% up move seen in the prior three weeks. The slower pace of retracement highlights a robust price structure, which augurs well for the next leg of the uptrend. Consequently, any dip from current levels could offer fresh buying opportunities as immediate support is placed near 55500 zone which is 50% retracement level of its preceding rally.
* Underperforming benchmark, PSU Bank index closed on a negative note, indicate follow through selling pressure. The index witnessed extended correction and closed below its 50-day EMA which was held since May, however we believe the stock to take a strong support at its previous horizontal trendline, which coincides with rising trendline support placed at 6800. Given that the Bank nifty consolidating below 2% from its all-time highs, The PSU Bank Index still lags significantly (10%) below its all-time high, setting up for a potential catch -up rally with risk-reward remains favourable for positional long strategy. After breaking out from an eleven-month falling trendline on 19th May, the index has maintained a higher-high-low structure as per Dowtheory on the weekly chart, signalling uptrend is intact. Immediate support on the downside is placed at 6,700, which is the recent swing low and coincides with the 20-week EMA.
* Structurally, the index is undergoing a time-wise correction rather than a steep price correction, which is a constructive sign in the context of a prevailing uptrend. The formation of higher base patterns near the near the key-moving average support zone, along with subdued retracements, implies that stronger hands are utilizing dips to accumulate
Please refer disclaimer at https://secure.icicidirect.com/Content/StaticData/Disclaimer.html
SEBI Registration number INZ000183631