Annual Market Outlook 2026 by SBI Mutual Fund

Executive Summary
Global Backdrop: 2025 was a strong year for global markets, with global equities and Emerging Markets fixed income outperforming Indian assets. Despite tariff-related uncertainties, global growth held up, supported by loose fiscal policies and AI-driven investments in the US. Trade tensions eased, though the India–US trade deal remains pending. Looking ahead, US growth ex-AI appears modest, Europe is fiscally expansionary, but China remains export-dependent, limiting global growth impulses for 2026. Inflation worries persists in the US, while elsewhere deflationary impulses from Chinese exports are strong. Yet for now, most central banks appear to be in final legs of easing unless growth falters meaningfully. EM economies may benefit from softer dollar and supportive liquidity.
India’s growth: Real GDP averaged 8% y-o-y in 1H FY26, but nominal growth was soft at 8.8%. FY26 nominal GDP likely ~8.5%, while real growth could appear statistically elevated at 7.5%. Nominal GDP expected to improve to ~11% in FY27, with real GDP statistically moderating to ~7.2%. FY27 growth will be domestically driven, led by consumption and credit revival. Exports remain the weakest link, while inflation stays benign and policy supportive. Structural reforms and premiumization trends reinforce a constructive medium-term outlook. Global slowdown and geopolitical remain the key risk
Policy Pivot: RBI cut repo by 125 bps in 2025 and infused liquidity (~INR 15.7 trillion since Dec’24), signaling a shift to growth orientation. Fiscal stance eased, and reforms accelerated— tax cuts, GST rationalization, labour code, 100% FDI in insurance, private nuclear investment, and revamped employment schemes. 2025 can be classified as the year of reforms which create a medium to long term structural positives for India.
Credit Revival: Bank credit rose from 9% in May to 11.4% by Nov’25; aggregate credit likely grew by 10.5–11% in FY26. Bank credit growth is projected at 13–14% in FY27; household credit likely to outpace corporate. Segments reliant on credit-driven demand and premiumization trends should outperform.
Capex: Corporate capex to stay healthy (early-teens), led by power, gas transmission, capital goods, and cement; central capex likely in line with nominal GDP as fiscal consolidation moderates.
Inflation & Policy: Inflation to average ~4% in FY27, still benign. Monetary policy likely on extended pause; liquidity support to continue.
Fiscal & Bonds supply: Centre’s deficit to ease to 4.2% in FY27; state deficits remain elevated. Government bond supply could rise to Rs. 29 trillion (vs. an estimated Rs. 27.2 trillion in FY26), keeping demand-supply tight.
Currency: INR depreciation expected to slow to ~2% in FY27 (~?92/USD), aided by potential global bond index inclusion, resumption of FPI equity inflow, contained CAD and trade deal optimism. REER has depreciated significantly in 2025
Equity Outlook: We expect the trends of 2025 to continue into 2026. EM equities and hard assets, including industrial commodities, should stay supported after years of underperformance on the back of improving global growth. India having moderated on valuations premium to EMs should receive its fair share of flows. Policy support should help growth which should help equities inch higher. However, equity supply puts a lid on the markets. Expect measured up move for large caps. Performance down the market cap spectrum may stay muted as market polarization increases on the back of valuation normalization. Rising polarization amidst moderate market returns should mean staying selective and focusing on bottom-up should help.
Fixed Income Outlook: Given the overall macro and demand dynamics in the current phase of the rate cycle, it is time to prioritise stability and accrual over a directional duration strategy. A moderate duration stance, with core accrual built around high-grade short tenor AAA bonds and selective exposure down the curve (consistent with fund risk mandates) is warranted in portfolios. Duration remains tactical in the current environment.
2025 Market Review: Global strength vs. Indian underperformance
2025 has been a relatively strong year for global asset classes, marked by a broad-based recovery. Positive momentum was seen across gold, equities in both emerging and developed markets, and emerging market fixed income assets. Overall, global equities and global fixed income significantly outperformed Indian markets during the year (Exhibit 1).
Global growth persists in 2025 despite tariffs
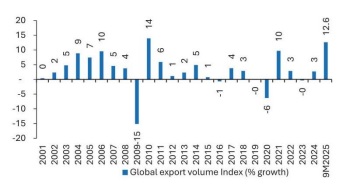
The US and global economies have delivered a surprisingly decent performance this year, despite ongoing protectionist trade policies and the fact that the Federal Reserve has only recently resumed rate cuts (Exhibit 2). Loose fiscal policies across most key economies (US, Europe, and China) and AI investment in the US have cushioned the impact of tariffs. To add, intensity of tariff has also watered down during the year. For all the noise, global trade performed rather well, with exports running at record levels in much of the region (Exhibit 3).
US’ trade war de-escalates with China and lopsided deals with most other nations
The US de-escalated its trade war with China in May 2025 and has been more lenient toward Chinese re-exports than initially expected. Most countries have entered into asymmetric trade deals with the US; however, these remain deals rather than formal agreements, raising questions about whether the current structure represents a sustainable equilibrium. Surprisingly, the India– US trade deal has taken longer to materialize than anticipated.
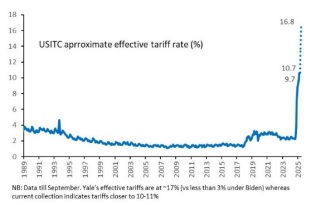
Collection based effective tariffs at ~10-11% vs. 2% a year ago
Back on Liberation Day, the effective tariff was projected to rise from around 2% to 28%. According to Yale Budget Lab’s study, the current effective tariff rate stands at 17–18%. Yet, based on actual collections, tariffs appear closer to 10–11%, likely due to transshipment practices (Exhibit 4). This indicates that tariff intensity has significantly diluted over the course of the year.
Above views are of the author and not of the website kindly read disclaimer