Weekly Technical Outlook - NIFTY FMCG : 40925.25 weekly change (+5.68%) By GEPL Capital

Follow us Now on Telegram ! Get daily 10 - 12 important updates on Business, Finance and Investment. Join our Telegram Channel
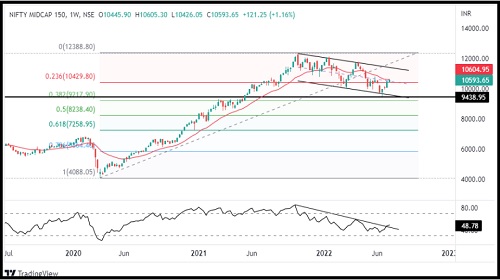
NIFTY MIDCAP 150 : 10593.65 weekly change (+1.16%)
Observation
* On the weekly chart of the NIFTY MIDCAP 150 we can spot that prices have shown a bounce from around the 38.2% Fibonacci retracement level of its advance from 4088 level (March 2020) to 12388 level (October 2021)
* Prices formed Hammer pattern around the crucial support of 9438 level, where in the following next week the high of the hammer pattern is taken out on the weekly charts, which indicated towards a positive sentiment for the Index.
* On the daily time frame prices have sustained above the 50 days EMA, which was acting as a resistance for the prices.
* RSI plotted on weekly time frame has also shown a breakout which suggests a built up in the positive momentum.
* The Index have immediate hurdle on the weekly chart i.e. the 20 week EMA (10605) followed by 10798 (Swing High) and 11216 (Multiple Touch points level).
* The strong support placed at 10418 (Multiple Touch points level) and 9937 (Swing Low).
Inference & Expectations
* Looking at the overall price structure and indicator set up, the Index is showing initial positive signals, however we must wait for some more confirmation to look for a long opportunity.
* We feel if the Index sustains above the 10798 marks then it will move towards 11216 levels in the coming future.
* Our positive view will be negated if the Index breaches below 9937 levels.
* Since the trend looks positive biased, the aggressive traders / investors can look for buying opportunity in the heavy weights of the Index like BEL, TRENT, ASHOKLEYLAND, TATAELXSI.
* Our bullish view will be negated if we see prices sustaining below 14860 level.
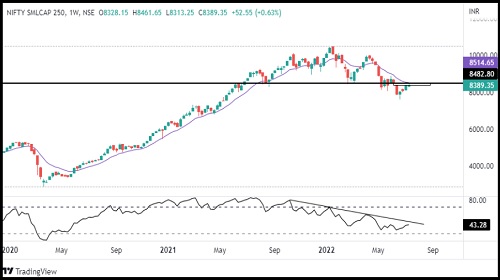
NIFTY SMALLCAP 250: 8389.35 weekly change (+0.63%)
Observation
* On the weekly chart of the NIFTY SMALLCAP 250, the prices have maintained its lower top, lower bottom formation on the swing basis which tells that prices still in a downtrend.
* The prices have breached and sustained below the crucial support of level 8482 with a gap on June 2022, which was acted as a support for the prices multiple times. Also the prices are below the 13 Week EMA, which acted as a variable resistance for the prices .
* Now the prices are retesting the breakdown level i.e. 8493 level, 13 Week EMA and the gap, which states that prices are at its crucial resistance.
* RSI plotted on weekly timeframe has sustained below the 50 mark (currently at 43.2) and is maintaining lower top, lower low formation indicating bearish momentum continues.
* The Index has strong resistance placed @ 8493 followed by 8874 & 9493. On the other side, the support levels would be 8216, 7998 and 7598 respectively
Inference & Expectations
* The price action and evidence provided by the indicators shows that the Index may continue its downtrend and we feel one can avoid making longs here in the constituents of NIFTYSMALLCAP 250.
* Our bearish view will be negated once we see the prices sustaining above the level of 8874.
To Read Complete Report & Disclaimer Click Here
SEBI Registration number is INH000000081.
Please refer disclaimer at https://geplcapital.com/term-disclaimer
Views express by all participants are for information & academic purpose only. Kindly read disclaimer before referring below views. Click Here For Disclaimer


More News

Nifty has an immediate resistance placed at 16360 and on a decisive close above expect a ris...