Weekly Technical Outlook - NIFTY FMCG : 40925.25 weekly change (+5.68%) By GEPL Capital

NIFTY FMCG : 40925.25 weekly change (+5.68%)
Observation
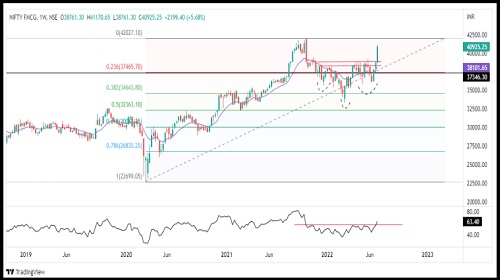
* On the weekly chart of the NIFTY FMCG, we can spot prices have shown a bounce back from the 38.2% of Fibonacci retracement level of its previous advance from 22699 (March 2020) till 42027 (October2021) .
* In the last week, the prices have given a breakout from an Inverse Head and Shoulder pattern on the weekly time frame, where the close is near to its weekly high, which indicates strong bullish sentiment of the sector.
* Prices have sustained above 13 Week EMA since last 3 Weeks, which was acting as a resistance for the prices.
* On Daily timeframe we witnessed a breakout from Double Bottom pattern on 22nd July 2022 and breakout from a consolidation pattern which was taking place since 130 trading sessions between the level of 35650 to 38780
* The breakout is in sync with its heavily weighted stocks, which constitute to 54.43% of the whole sector, ie. ITC (29.71%) & HINDUNILVR (24.72%).
* RSI plotted on weekly time frame has also shown a breakout and has sustained above 60 mark, Indicating strong positive momentum.
Inference & Expectations
* The overall price pattern and indicator set up of the NIFTY FMCG sector indicates strong positive undertone for the short to medium term.
* The Index can move higher towards the 43000 followed by 45348 level.
* Our bullish view will be negated if the level of 37400 is taken out on downside.
NIFTY FIN SERVICE : 16260.20 weekly change (+4.09%)
Observation
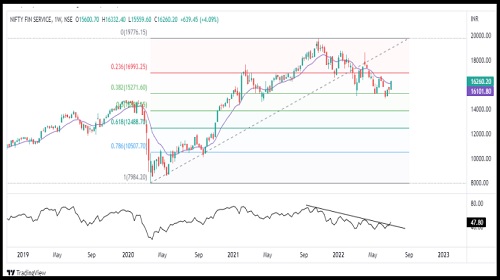
* On weekly chart of the NIFTY FIN SERVICE, we witnessed the prices have shown a bounce back from the 38.2% of Fibonacci retracement level of its previous advance from 7984 (March 2020) till 19776 (October2021) .
* In the previous week, we saw the prices closing above 13 Week EMA which was acting as a variable resistance for the prices.
* Around the level of 14850 we can see the CIP formation (Change in Polarity) by the prices. ? On daily time frame, we witnessed prices have sustained above 50 Days EMA, which indicates bullish sentiment of the sector.
* RSI on the weekly time frame has given a breakout from the downward slopping trend line in the previous trading week, which indicates strong positive momentum.
Inference & Expectations
* The price action and evidence provided by the indicators shows start of an up move.
* Going ahead the Index can move higher till the level of 17400, if it managed to cross 17400 levels, the prices can further move higher till the level of 18750.
* Our bullish view will be negated if we see prices sustaining below 14860 level.
To Read Complete Report & Disclaimer Click Here
SEBI Registration number is INH000000081.
Please refer disclaimer at https://geplcapital.com/term-disclaimer
Views express by all participants are for information & academic purpose only. Kindly read disclaimer before referring below views. Click Here For Disclaimer


Tag News
More News

Market Watch : Global markets brace for Iran response after US strikes by Geojit Financial S...