Weekly Tech Picks - Mahindra & Mahindra Limited, NMDC Limited, Shriram Transport Finance Company Ltd, Hindustan Aeronautics Ltd By Axis Securities

Mahindra & Mahindra Limited
• On the weekly chart, the stock has sharply rebounded from its two years “multiple support” zone of 730-720 levels indicating strong come back of bulls
• This buying momentum was observed from 20-day SMA and rebounded sharply Mahindra & Mahindra Limited Weekly Tech Picks 01 April,2022
• On the daily chart, the stock has formed higher top and bottom indicating positive trend
• The daily “band bollinger” buy signal reconfirm positive bias
• The daily and weekly strength indicator RSI is in bullish mode along with positive crossover which supports rising strength in near term.
• The above analysis indicate an upside of 860-885 levels.*Holding period is 3 to 4 weeks
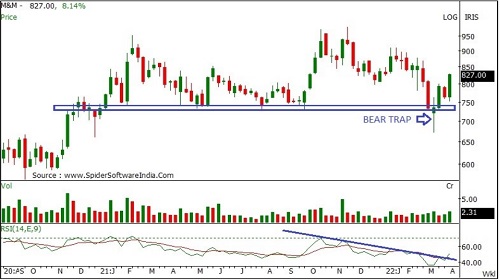
Buy Mahindra & Mahindra Limited Buy Range: : 820-804 CMP 825 Upside: 6% - 9% Stop loss: 781
NMDC Limited
• On the weekly chart, the stock has confirmed “rounding bottom” formation on a closing basis indicating strong come back of bulls
• The stock has recaptured its 20 , 50 and 100 day SMA and rebounded very sharply
• Rising volumes on a rally implies 01 April,2022increased participation at lower levels
• The daily and weekly “band bollinger” buy signal reconfirm positive bias
• The daily and weekly strength indicator RSI signals positive crossover indicate rising strength
• The above analysis indicate upside of 175-182 levels. *Holding period is 3 to 4 weeks.
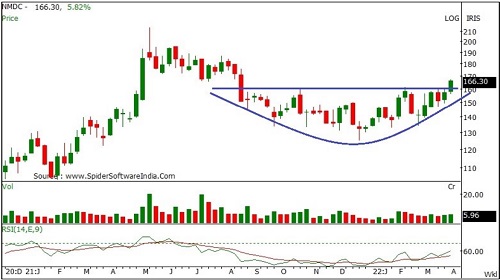
Buy NMDC Ltd Buy Range: 164-160 CMP 166Upside: 8% – 12% Stop loss: 157
Shriram Transport Finance Company Limited
• On the daily chart, the stock has witnessed a strong breakout from its six months “down-sloping” trend line breakout indicating short term trend reversal
• The stock has recaptured its 20 and 50 day SMA and rebounded very sharply
• Rising volumes near breakout zone 01 April,2022implies increased participation
• The daily “band bollinger” buy signal reconfirm positive bias
• The daily and weekly strength indicator RSI signals positive crossover indicate rising strength
• The above analysis indicate upside of 1275-1310 levels.
• *Holding period is 3 to 4 weeks.
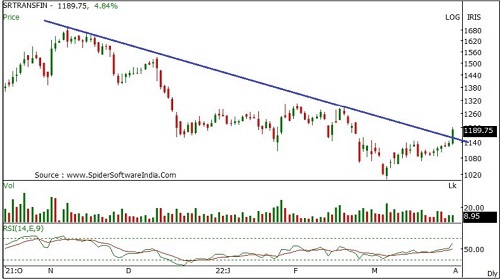
Buy Shriram Transport Finance Company Limited Buy Range: 1190-1167 CMP 1190 Upside: : 8% – 11% Stop loss: 1125
Hindustan Aeronautics Limited
• On the weekly chart, the has confirmed “rounding bottom” formation breakout at 1500 levels on a closing basis
• It has also confirmed higher tops and bottoms indicating strong up trend
• The stock has recaptured its 20, 50, ,100 and 200 day SMA and rebounded very sharply 01 April,2022• Huge volumes around breakout zone implies increased participation
• The daily and weekly strength indicator RSI signals positive crossover indicate rising strength
• The above analysis indicate upside of 1640-1685 levels.
• *Holding period is 3 to 4 weeks.
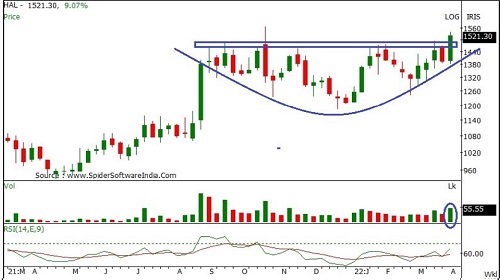
Buy Hindustan Aeronautics Limited Buy Range: 1520-1490 CMP 1521 Upside: 9% – 12% Stop loss: 1430
To Read Complete Report & Disclaimer Click Here
For More Axis Securities Disclaimer https://simplehai.axisdirect.in/disclaimer-home
SEBI Registration number is INZ000161633
Views express by all participants are for information & academic purpose only. Kindly read disclaimer before referring below views. Click Here For Disclaimer