USDINR June futures formed Doji candlestick pattern near previous bottom indicating indecisiveness - HDFC Securities

All Eyes will be on Central Banks
Bucking the historical down trend of weakness in May month, Indian rupee gained 2.21% to 72.45 a dollar following weakness in broad-based dollar index, strong foreign fund inflows and risk-on sentiments. Even after sharp surge in domestic virus cases and weaker economic data, market placed for better prospectus of inflows as market participants rush for higher carry and better return with lower volatility. Central bank is in no mood to stop the appreciation following higher commodity prices and may give room for rupee appreciations.
For the quarter end adjustment and central bank policy decision, forex markets likely to see relatively higher volatility and set the stage for trend reversal. Spot USDINR is expected to trade with negative bias in coming month as there are series of IPO could hit the market which will be favourable for rupee bulls.
Spot USDINR is having crucial support at 72.27 and breaking of the same will open the way for 71.50 and 70.50 while resistance has been shifted to 73.80.
In the month gone, country’s foreign exchange hit the record high of $592.89b for the week ending 21 May, reserves up by $4.9b from April end’s $588.02b.
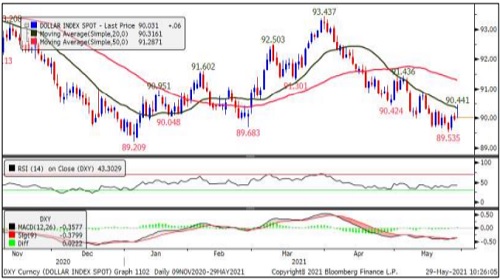
Technical analysis matters a lot in the foreign exchange markets, and that moment helped traders decide that they weren’t prepared to take it higher. Two months ago, the dollar index was rallying, and touched its 200-day moving average, suggesting that it was ready to break higher Now the dollar index is at another possible parting of the ways. If the currency drops further from here, it sets a new seven-year low, and strengthens the belief that it is now in a secular downturn. From the technical level front, we will focus on 88 level on downside 92 on upside.
The critical questions to answer in June, will we have the appetite to take the dollar lower? On balance, we should prepare for a major period of dollar weakness- unless the next raft of data shows that inflation really does take off in the U.S. and forces the Fed into tightening earlier than it wants
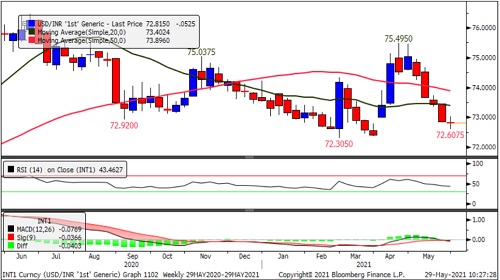
USDINR
USDINR June futures formed Doji candlestick pattern near previous bottom indicating indecisiveness.
The pair closed well above short term moving average while having resistance at 50 DMA at 74.20.
Momentum oscillator, Relative Strength Index of 14 week periods southwards and placed below 50 mark suggesting weaker momentum.
MACD line flattened below zero line which is suggesting consolidation.
The above technical evidences suggesting continuation of bearishness but as there is doji candle on weekly chart short term traders should wait for 72.60 to break.
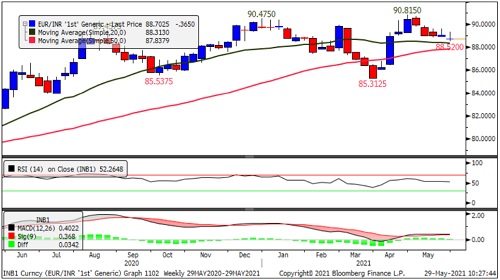
EURINR
The spread between 20 and 50 weeks moving averages getting narrowed and might get flat following consolidation in the price. EURINR June futures made second doji with lower closing indicating higher level selling. However, the trend still remains positive amid higher top higher bottom formation on weekly chart.
Momentum oscillator, Relative Strength Index of 14 weeks placed above 50 with flat line indicating consolidation.
Near term trend for EURINR June futures likely to consolidate with near term support at 87.80 and resistance at 90.80
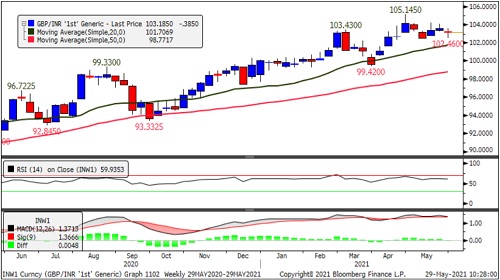
GBPINR
GBPINR formed doji candlestick pattern on weekly chart and has been consolidating in the range of 102 to 104 through the month. The pair has been holding the support of 20 Weeks simple moving averages.
The formation of higher highs and lows on daily and weekly span indicating continuation of upward momentum.
Momentum oscillators and indicators on weekly chart flatten near overbought zone suggesting consolidation.
GBPINR June futures medium term trend remains bullish with higher side resistance at 105 and support at 101.50.
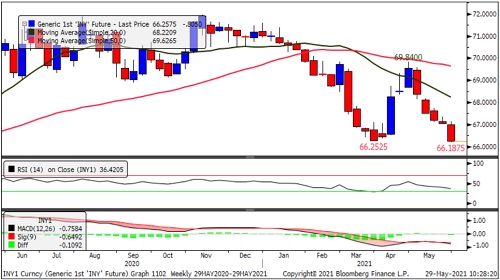
JPYINR
JPYINR futures fell for a fifth week in row indicating bearishness. The pair also broken the previous bottom support of 66.25.
The short term moving averages are placed below medium term moving averages suggesting down trend.
Momentum oscillator, RSI on weekly chart hovering near oversold zone while MACD placed below zero line with negative cross over indicating continuation of bearish trend.
We remain bearish in JPYINR June futures and expect pair to head towards 64 odd levels after some short covering bounce.
Dollar
Dollar index resisted at short term moving average of 20 days. The formation remains bearish amid lower top lower bottom on daily and weekly time frames. Momentum oscillators are highly oversold on daily chart indicating consolidation with minor short covering bounce. Near term outlook for DXY remains bearish until it starts forming higher highs and lows. The buck has support between 89 to 88 range while resistance at 92.50.
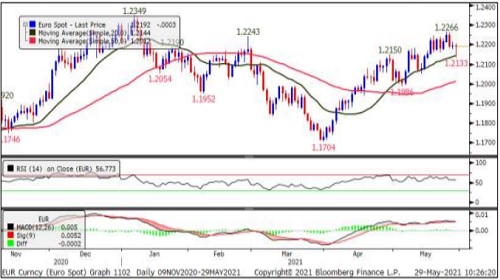
EURUSD
As we can see from the chart, EURUSD is mirroring the DXY amid higher weight in index. It has been holding well above short term moving average with higher top higher bottom. Though, the momentum oscillators are hovering near overbought zone, the formation of negative divergence could limit the upside. Short term trend for EURUSD remains bullish till it holds 1.20 while on higher side we see resistance at 1.2350.
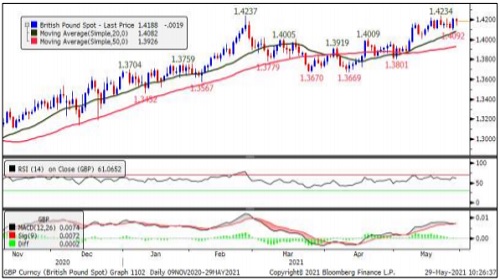
GBPUSD
GBPUSD steadily moving north with higher highs and lows on daily chart. The sustainable trade above 1.425 will open for 1.44 level. The pair has support at 1.4082 and 1.3926, the 20 and 50 days moving average line. Momentum oscillators are hovering near overbought zone indicating consolidation. We remain bullish in GBPUSD and expect level of 1.43 in coming weeks.
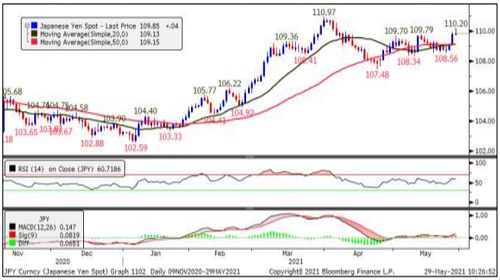
USDJPY
USDJPY forming higher highs and lows on daily chart while the range remains tight between 108 to 110. The pair has strong support near 109 level. Momentum oscillators and indicators signaling bullishness. From the level front, short term traders should watch 110 for fresh upward move while breaking below 109 will negate the bullish view
To Read Complete Report & Disclaimer Click Here
Please refer disclaimer at https://www.hdfcsec.com/article/disclaimer-1795
SEBI Registration number is INZ000171337
Views express by all participants are for information & academic purpose only. Kindly read disclaimer before referring below views. Click Here For Disclaimer