USDINR February futures closed well below multiple bottom support indicating break down on daily chart - HDFC Securities

Follow us Now on Telegram ! Get daily 10 - 12 important updates on Business, Finance and Investment. Join our Telegram Channel
Rupee Likely To Open Lower On Risk-off Moods - HDFC Securities
Indian rupee in line with other Asian peers gained against American dollar, following rally in risk-assets. Spot USDINR ended the week with gains of 17 paise or quarter percentage point to 72.76, highest level since March 2020. The break of 72.75, technically, opens for 72.40 in coming days while previous bottom 72.90 becomes resistance. The bias remains bearish in USDINR amid strong foreign inflows, higher carry, low volatility, weaker greenback and rebound in domestic economic activities.
On Friday, two crucial data, inflation and industrial output data came which were better than market expectations. Retail inflation touched a 16 month low led by a sustained decline in food inflation which is at a 20 month low. The CPI stood at 4.06% in January compared with 4.59% in December and from expectation of 4.4%. Industrial activities also witnessed a growth of 1% from previous months 0.45% led by growth in manufacturing and electricity sector.
Forex Reserves: India’s forex reserves down by $6.24 billion to $583.945 billion for the week ended February 05, RBI data showed. Decline in the forex kitty was mainly on account of a fall in foreign currency assets (due to decline in non-dollar currencies) and gold reserves.
CFTC Data: The most notable flows were in yen (sales of 10k) and sterling (buying of 11.5k). Flows elsewhere were mixed, with modest buys of EUR and AUD and sales of CHF and CAD. The overall dollar short fell by about $600 million over the week.
Week Ahead: There will just be four trading sessions in India because of the holiday on Friday on account of Shivaji Jayanti while US market will remain closed on Monday on account of President day. The big events to be watched are India trade balance, WPI on Monday and the FOMC minutes on Wednesday. All eyes will be on Japan and EU GDP number.
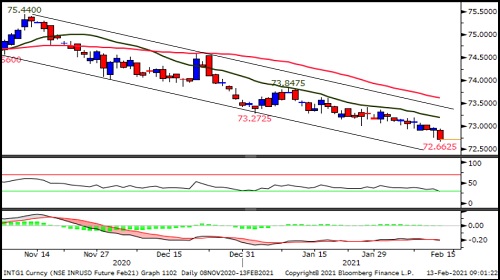
USDINR
USDINR February futures closed well below multiple bottom support indicating break down on daily chart.
It has been trading well below short term moving average.
The channel support has been placed around 72.25.
Momentum oscillators entered in oversold zone suggesting continuation of downward momentum.
Option Distribution data suggest maximum pain level of 73 and call writing of 73 strike will act as near term resistance while put buying at 72.50 strike provide support.
Looking at the above evidences, we remain bearish and looking for 72.25 in coming week. Short sellers should trail stop loss to 73.25 from 73.50.
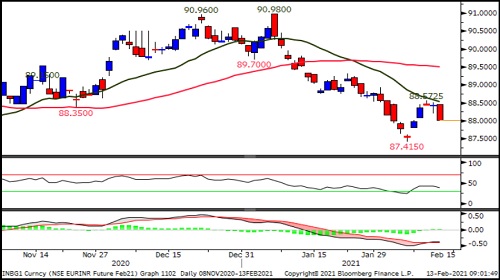
EURINR
Our view of short covering bounce vindicated in last week and pair made high of 88.57 before closing at 88 level.
EURINR February futures resisted at 20 Days Exponential Moving Average and continued bearish chart pattern of lower top lower bottom on daily chart. The pair is having multiple bottom support at 87.30 and resistance around 89.50.
.Momentum oscillators RSI and MACD pointing towards recovery while averages and price patterns contradicting with oscillators, indicating Continuation of down trend.
Looking at the above technical evidences, we believe EURINR February futures likely to consolidate in range of 89.50 to 87.30 in coming days.
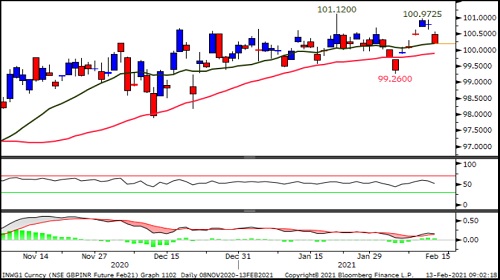
GBPINR
GBPINR February futures bearish candle formed after doji candle near recent top theoretically, could be a sign of reversal in trend but we have different view following two month side way price action and previous week’s false break down.
Momentum Oscillator, RSI is placed around 50 odd levels and turned upward suggesting continuation of upward momentum.
We believe just like false breakdown this could also be false breakout while trend remains up one should see broad range of 101.50 to 99.25 as trading range.
The swing traders can used the range of 101.25 to 99.25 as buy low sell high with small stop loss and any level above 101.50 open for new higher range.
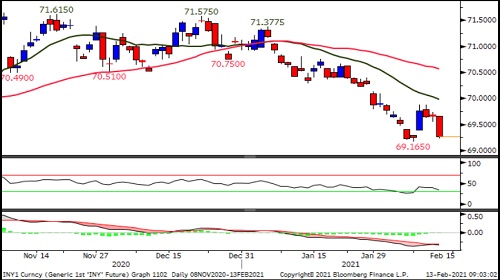
JPYINR
JPYINR February futures took a breath after falling for seven week in row and reached the lower band of the rectangle pattern (In formation since April 2020) at 69. However, the gains were limited and bias will be bearish .
There is negative cross over of moving average, short term moving averages are placed below long term averages suggesting down trend in the pair.
Momentum oscillators on daily and weekly chart again turned back suggesting downward momentum.
Looking at the daily and weekly technical indicators and patterns, we remain bearish and breaking of 69 will open for 67 while it may resist around 70.50 level in coming weeks.
To Read Complete Report & Disclaimer Click Here
Please refer disclaimer at https://www.hdfcsec.com/article/disclaimer-1795
SEBI Registration number is INZ000171337
Views express by all participants are for information & academic purpose only. Kindly read disclaimer before referring below views. Click Here For Disclaimer


Tag News

EURINR trading range for the day is 89.13 - 89.49. - Kedia Advisory


More News

GBPINR is consolidating in the range of 96.97.58 - Swastika Investmart